


Credit Crisis Reflections and Mark to Market Myths
Interest-Rates / Credit Crisis 2008 Apr 04, 2008 - 10:29 AM GMTBy: Ty_Andros

 The tumultuous 1st quarter is now behind us and what a quarter it was. VOLATILITY IS OPPORTUNITY and wonderful fireworks of volatility exploded across all asset classes providing bucket loads of OPPORTUNITIES for prepared investors. Your investment portfolios should be considerably higher in value, for rarely do we see moves of this magnitude across all sectors almost without interruption. This phase is now coming to an end and, as we all know, markets are NOT one-way affairs and the inevitable intermediate term corrections now appear to be beginning to unfold.
For greater insight into our publication, have a look at the Overview of Tedbits . It helps current and potential subscribers understand our mission in serving you. It also gives a broad description of what's unfolding globally and what you can expect from Tedbits as a regular reader.
The Ides of March did appear as markets spiked to highs or lows, depending upon which one you are observing. We can now look for intermediate term corrections to unfold across all markets. But don't be fooled, NOTHING HAS CHANGED. This is the pause that refreshes these investment themes and LONG TERM trends . Making long-term investment decisions based on short-term market directions or media headlines can cause extreme pain; ignore the headlines, DO YOUR HOMEWORK and thrive!
The banking system is STILL broken and in need of recapitalization and it will not recover until balance sheets are repaired. Simply put, credit will not flow until these balance sheets and counterparty solvency issues are resolved so you can expect continued easing of short-term rates and stealth balance sheet repair by the federal reserve and regulators. Interest rates are headed lower immediately to facilitate this, look for 1.75% in April or May at the latest. The MONEY printing and credit creation -- for the banks and brokers in need of rescue -- is set to continue ad infinitum (the Crack-Up Boom is set to accelerate) . Regulators are still AWOL and not only avoiding the problems, but contributing to them as they refuse to take on the big banks and brokers who are their masters (see Marking to Myths later in this issue).
The Federal Reserve and G7 central banks are still socializing risks and rewarding reckless behavior, so we will see more of it. The federal government, the plunge protection team and the Federal Reserve stepped over the line and dramatically widened the definition of “too big to fail” and they will continue to do so. Rightly so, since the alternative in a world of $45 trillion dollars of credit default swaps is deflationary depression. (Authors note: last week I had a typo which appeared to support the alternative, rather than an inflationary recession. There is no choice: It's inflate or die and I support the latter).
There are still supply constraints and demand expansion across most, if not all of the commodity, natural resource and metals sectors. The dollar is set to rise in a short covering bonfire. Use these periods to take profits and to position for the next moves in the directions of the long-term trends at more favorable entry prices. Classic COUNTER TREND moves in markets from weak hands to strong are set to occur and have commenced as of mid to late march. Let's take a look:
Reflections
Most markets move in long-term trends UP or DOWN, they usually last years (quite often decades) and rarely do they become trendless. We are going to take a quick trip through stocks, commodities, interest rates and the currency markets. Most markets are CORRECTING as I write this. Counter trend moves can be expected and seen in all sectors at this point. Remember, charts in general contain all FUNDEMENTAL information in their prices. In this piece we are going to look at long-term charts to allow us to better understand the BIG picture and peak at shorter term charts to get short-term insights. First we are going to look at a long-term chart of the Dow Jones Industrials by contributor Garret Jones. This chart is a logarithmic chart of the Dow and the trend line we are looking at extends all the way back to the absolute last bottom in 1974.
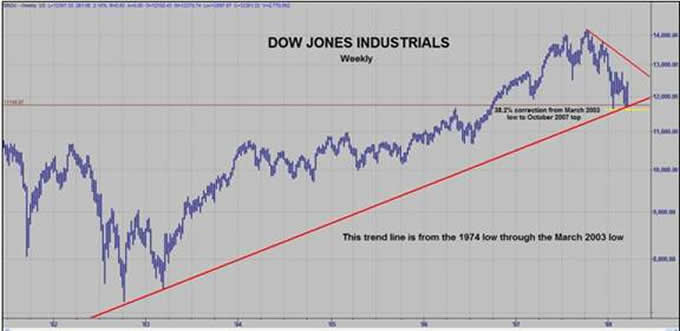
Isn't that an interesting picture? We see a trend line support level going ALL THE WAY back to the beginnings of the mega bull market in stocks. Looking carefully, we can see a PERFECT Fibonacci 38.2 % retracement of the move of the last trend line KISS in March 2003. Add to this the fact that in years ending in 8, going back 150 years or 15 decades, a low has NEVER been recorded after the first week in April. Investor sentiment is at levels not seen since March 2003.
As anyone who reads my commentary knows, I believe we are in a cyclical bear market in equities, not secular (See Tedbits archives for the “Crack-Up Boom” series at www.TraderView.com ). As long as they create FIAT currency and credit as they are, stocks can NEVER be expected to decline for long. They will just rise to reflect their repricing in the currency in which they are denominated (currencies don't float they just decline at different rates) with nominal gains to reflect the loss of purchasing power, not to be confused with REAL gains as measured in gold. The transport averages are signaling strength and are in position to lead a rally. This is where you can look for an intermediate-term RALLY to ensue, extending the prophesy of the years ending in 8 for another decade.
Now let's look at the Commodity Research Bureau (CRB) basket of commodities drawn on a weekly chart going back to mid August of 2007:
 |
July 2007 2008 |
This could easily fall back to the BOX (as Dennis Gartman terms it) which would represent the Fibonacci 50 to 62% retracement of the move since last August. The deeper it extends in retracements of PRICE and TIME, the stronger the ensuing resumption of the long-term trends in the underlying commodity components can be expected. Now let's look at three of the little Indians or subcomponents of the CRB since last August, those being Crude Oil, Gold and economic barometer Dr. Copper:
 |
 |
Crude Oil |
Gold |
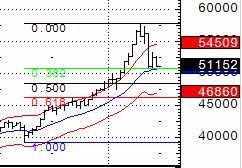
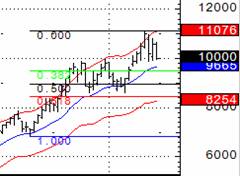
These charts are drawn off the July and August lows and are the PICTURE of health! Oil probably has further to go and Gold could stop RIGHT here. Can they fall further? Yes. They will probably find support soon as the 20-week exponential moving average would indicate. These two markets are as hooked up as they have been throughout time, a barrel of oil costs the same thing in gold today as it did in the depression. Now let's look at Dr. Copper which, by the way, has only 2 DAYS of stockpiles in the warehouses:
 |
2006 2007 2008 |
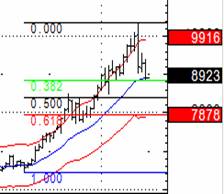
As anyone following the metals markets KNOWS, the patterns are clear, they consolidate generally in triangles, we can see one in gold in 2006 and for shorter periods since that time, ditto silver, and NOW copper is signaling a mega break higher, just as silver recently did when it broke from its 2-year base (See The 2008 Outlook in the Tedbits archives at www.TraderView.com ). See how it broke out of the pattern and went back and TESTED the breakout, confirming the price action!!! This is not the picture of a faltering GLOBAL economy! Notice the reverse head and shoulders emerging which will confirm the pennant? Can you say INVEST in industrials and natural resource stocks? Demand in the emerging world is alive and well, building cars, airports, factories and burgeoning middle classes through AUSTRIAN economics, and growing incrementally on a daily basis. This is a mega pattern POINTING to an objective of $5.47 cents a pound. Whoops, can you say the next leg of the BULL MARKET in copper is commencing?
In last week's Barons they declared the commodity Bull Market dead saying it was a bubble. The reporter who writes the commodities section trots out a “commitments of traders” specialist (try trading markets based upon this information and you will get killed), he points to the commercials being short; of course their short, they are HEDGING their production and LOCKING in their prices for their products, whatever those products may be (corn, wheat, rice, industrial metals, energy products, interest rates, currency exchange rates, etc.) .
That “Commitments of Traders” is not an opinion on the future direction of price; it is a way of making their businesses stable and locking in margins and prices: nothing else . This is why futures exchanges were created . This is what commercials do in futures markets: They hedge their exposure against the speculators which provide them liquidity (how can the commodities expert at Barons not know this or challenge this OPINION? Because he is a JOURNALIST not a market specialist and the big banks and brokers that advertise in Barons desperately wish inflation and the commodities bull to disappear as they sell PAPER! Can you say in the tank for the advertisers?). He absolutely does not have a handle on emerging markets and the implications of 3 billion people's standard of living on the rise. Do you understand what a teacup of oil or corn use multiplied by 3 billion translates to in increased demand? It's ENORMOUS. He does not explain why; if this is a bubble where are the SURPLUSES of the aforementioned commodities.
The only thing that his analysis would indicate is yes, there is a bubble and surplus of FIAT CURRENCIES which are IOU's in disguise. As long as we see these articles in the main stream financial press we know the party has just begun as the public is fooled into staying on the SIDELINE, they will miss the bull market and they will buy them when they are at new highs every time. Clyde Harrison says: “before this bull market is over there will be a bounty on caribou, drilling of oil wells in front of Barbara Streisand's home and a coal mine in Al gore's yard”. At that point you will know it's OVER, but not before!
Now let's take a look at the Treasury Markets and that risk-aversion trade which is actually the opposite, as anyone who has bought a treasury note is now staring blistering losses in purchasing power through inflation and CAPITAL losses from buying PANIC highs in price. These people, also known as the public, are going to get punished good and hard for acting on the main stream financial media's hysterical headlines.
Investors are being manipulated like ping pong balls directly in the sights of the carnival barkers in New York and London who pick them off for investing according to the headlines. The main stream financial press is no different than the weekly gossip magazines who are screaming: buy paper, buy paper, the housing market is bottoming, the commodity bubble is popped, etc. Trying to get you to do the wrong thing, they are doing the opposite in their PROPRIETARY trading operations. This is immoral behavior.
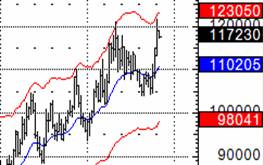
Now let's look at the treasury market; A 10-year Note yields 3.59%, 5-year Note yields 2.64%, a 90- day T Bill 1.3%, and 30-day Bills pay about .5 of 1 percent. The public which has bid these instruments in a “flight to safety” has once again failed to achieve their goals. They look for return of principle, whoops looks like lots of principle risk from here. Take a look at QUARTERLY charts of the US 10 and 5-year notes:
 |
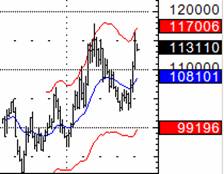 |
1990 2000 10-Year Notes |
1990 2000 5-Year Notes |
Can you say “about to be crushed in terms of capital losses when they revert to the exponential moving averages?” Prices have been this high and rates this low ONLY one other time in over 50 years and that was the 2 nd quarter 2003, there is only one way this market has to run and that is? DOWN. How about purchasing power? Let's use the rule of 72 to figure out what type of purchasing power losses these holders are about to face. 72 divided by inflation of (I will be kind) 9 percent. In the case of the 10-year note it will lose half its value over the next 8 years, and in terms of the 5-year a 31% loss of purchasing power will be seen between now and redemption time. (Look at The 2008 outlook in the Tedbits Archives at www.TraderView.com and see what I predicted at that time about these markets, good job Bob).
Anyone who is in at those highs we see is in severe jeopardy of CAPITAL losses ON TOP of purchasing power losses. SAFE and risk free? I beg to differ, not when MZM (money with zero maturity) is expanding at 30 percent and reconstructed M3 is running at over 17% growth rate. Those 2.5 standard deviation moves on quarterly charts suggest a BANG that could be heard around the world when they revert to the mean!
Now let's turn to the currency markets where we could see countertrend moves in all the long-term trends. I covered this last week but it deserve a second look due to the long-term nature of the changes forecast by price, time and sentiment. We will look at last week's charts again and I will include a chart of the dollar index against a trade weighted basket of currencies. The first two charts are of the Japanese Yen and Swiss Franc giving us a look at several of the largest pools of established currencies in the Pacific Rim and Europe 's private banking capital.
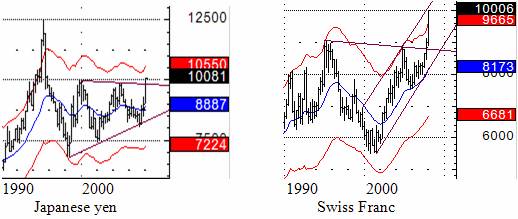
As I said last week, these markets are screaming new realities for YEARS to come between Europe and the Pacific Rim . Look at the immense bases from which these are coming out, built over a 12-year period, they are huge. THEY PROJECT 30 TO 40% MOVES AGAINST THE DOLLAR OVER MANY YEARS. You can expect these pattern breakouts to be TESTED as countertrend moves emerge. It would actually appear the Swiss Franc is confirmed and the Yen is in the process of confirming NOW.
 |
1990 2000 Dollar index |
Now let's take a look at the Dollar against a trade weighted basket of currencies known as the Dollar Index: symbol DX
Notice how the Dollar Index is almost a mirror image of the Swiss Franc chart? It's uncanny. What a REFLECTION! Freight trains headed in opposite directions but with destinations a long way from here. Momentum is king NOW, but countertrend moves can be expected at some point soon. Over the longer term the prognosis for the dollar is GRIM. Keep in mind that gold is in a bull market AGAINST ALL THREE OF THEM. Currencies don't float, they just SINK at different rates!
Ignore the messages of these charts at your peril. Those are huge LONG-TERM bottoms and tops in terms of price and sentiment and they signal long-term OPPORTUNITIES for those that see the messages contained in them, and huge losses for those who disregard them.
Return of Marking to Myths!
As we all know, the G7 financial authorities are fighting tooth and nail to rescue their financial systems. The bottom line of it is that they are INSOLVENT and require balance sheet repair of epic proportions. It will require a combination of MONEY printing, hocus pocus, smoke and mirrors and changing the rules -- whether it be the changing of balance sheet requirements at Fannie and Freddie, the expansion of the home loan banks, term lending facilities of one sort or another or opening the borrowing windows at the fed wider and wider in terms of eligible securities of participants (investment banks) which can access the lending. In the last 6 weeks we have seen over 1 trillion dollars in combination of all of these things added to the pool of liquidity to underpin asset markets.
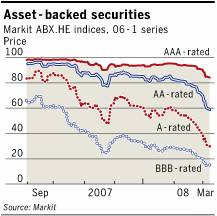 Now comes the latest twist: “The return of marking to model” which was ended last November. Tedbits wrote about it at the time and it has bitten the banks and financial industry's balance sheets HARD. So the SEC, bowing to pressure from their masters: Congress, The Fed, The Treasury, the Plunge Protection Team and the banking and brokerage industries, has revised the regulatory guidelines for applying SFAS rule number 157. This rule required marking to market when there are observable prices of hard-to-price and almost impossible-to-sell over the counter securities (CDO's, CMO's, MBS, etc). Here is a chart that illustrates the problem:
This is a picture of financial industry and banks' balance sheets VAPORIZING before our very eyes. So what do the financial and banking authorities do? What else? Rewrite the regulatory guidance in respect to how to value them for REGULATORY reporting purposes. The SEC has issued an opinion letter:
( http://www.sec.gov/divisions/corpfin/guidance/fairvalueltr0308.htm ) informing financial and banking companies of how to deal with these thorny balance sheet and accounting compliance issues by telling them if they have a problem with the mark to market valuations then declare the prices as the result of forced liquidation and ignore them . And how did they sidestep the horrendous losses due to be reported in the next three weeks from the 1 st quarter? By backdating the interpretative notice back to January 1. Abracadabra: poof and money reappears on the balance sheets, hocus pocus of the highest order. That rule saw the light of day for a total of 45 days!!! Now it's history.
Now, instead of marking to market from REAL trades, they say those prices are “myths” and represent not the true nature of the prices of those securities, as they were the result of FORCED liquidation and margin calls. Now white is black and black is white as we move further into the lands of George Orwell and his prophetic book 1984 . By moving this back to marking to myths they have RESTORED billions of Dollars to bank and financial balance sheets with the stroke of a pen, if not in reality.
In conclusion: NOTHING has changed, not one thing. When the main stream financial media advertises the views of the main stream banks and brokers, understand they are setting you up for a haircut and they are the barber fleecing you like a sheep. These people deal in the land of paper and paper is in a bear market and will remain so till this “Crack-Up Boom” runs its course. But they still must pretend that their decades in the sun (1980 until just last year) have now run their course. Their customers are in for a rough ride as they follow their investment advisor's guidance to their demise.
These misconceptions are INVESTMENT opportunities for YOU! You can take their sheep to the bank and your investment portfolio, as uninformed investors step away from big market themes based upon articles in Barons and people like the chief investment officer at Citigroup who is talking their book. No matter which of these it is: YOU LOSE! You need to be in the STRONG and smart hands crowd, not the investing by headlines crowd.
When you see rallies like we had on the first day of the quarter you must keep in mind that a lot of the big money is now being run by models that sell lows and buy highs. These people running the money were in Diapers in the 70's and 80's. They are Quants that have now ascended to high priests in the money center and investment banks. They are big money and are entering BIG positions late and exiting big positions early, many times with the weakest hands represented by the public. The estimable Art Cashin has commented on this numerous times, now he is a sage and oracle. Four decades of experience and brave enough to call a spade a spade. Just like Clyde Harrison.
Now here's a closing thought for you: The housing market represents approximately 11 trillion Dollars of mortgages, 1 trillion Dollars of them are in trouble. Approximately 220 billion up to $1 trillion Dollars of losses have been recognized by the financial and banking system. Consumer finances are crumbling; securitized credit card and car loans are now falling into arrears and are problems on the near horizon. Taxes and regulation are set to rise in excess of the abomination that we currently have in the G7. So, wealth creation and capitalism are set to suffer another withering blow at the hands of our PUBLIC servants. And over 100 trillion Dollars of unfunded obligations remain throughout the G7. There is only one solution which leaves the G7 financial, political and banking system in place: They will print the money as now it is, INFLATE or DIE!
Look at what the markets have done so far. Big opportunities have been offered and captured by prepared investors since the storm started in July. The opportunities we have seen so far are DWARFED by those in front of us! The Crack-Up Boom has a lot of wind at its back so unfurl your investing sails properly and CAPITALIZE on it…..
Thank you for reading Tedbits if you enjoyed it send it to a friend and subscribe its free at www.TraderView.com don't miss the next edition of Tedbits.
If you enjoyed this edition of Tedbits then subscribe – it's free , and we ask you to send it to a friend and visit our archives for additional insights from previous editions, lively thoughts, and our guest commentaries. Tedbits is a weekly publication.
By Ty Andros
TraderView
Copyright © 2008 Ty Andros
Hi, my name is Ty Andros and I would like the chance to show you how to capture the opportunities discussed in this commentary. Click here and I will prepare a complimentary, no-obligation, custom-tailored set of portfolio recommendations designed to specifically meet your investment needs . Thank you. Ty can be reached at: tyandros@TraderView.com or at +1.312.338.7800
Tedbits is authored by Theodore "Ty" Andros , and is registered with TraderView, a registered CTA (Commodity Trading Advisor) and Global Asset Advisors (Introducing Broker). TraderView is a managed futures and alternative investment boutique. Mr. Andros began his commodity career in the early 1980's and became a managed futures specialist beginning in 1985. Mr. Andros duties include marketing, sales, and portfolio selection and monitoring, customer relations and all aspects required in building a successful managed futures and alternative investment brokerage service. Mr. Andros attended the University of San Di ego , and the University of Miami , majoring in Marketing, Economics and Business Administration. He began his career as a broker in 1983, and has worked his way to the creation of TraderView. Mr. Andros is active in Economic analysis and brings this information and analysis to his clients on a regular basis, creating investment portfolios designed to capture these unfolding opportunities as the emerge. Ty prides himself on his personal preparation for the markets as they unfold and his ability to take this information and build professionally managed portfolios. Developing a loyal clientele.
Disclaimer - This report may include information obtained from sources believed to be reliable and accurate as of the date of this publication, but no independent verification has been made to ensure its accuracy or completeness. Opinions expressed are subject to change without notice. This report is not a request to engage in any transaction involving the purchase or sale of futures contracts or options on futures. There is a substantial risk of loss associated with trading futures, foreign exchange, and options on futures. This letter is not intended as investment advice, and its use in any respect is entirely the responsibility of the user. Past performance is never a guarantee of future results.
Ty Andros Archive |
© 2005-2022 http://www.MarketOracle.co.uk - The Market Oracle is a FREE Daily Financial Markets Analysis & Forecasting online publication.