


SP500, NAS Stock Market New Highs v Your Individual Stocks
Stock-Markets / Stock Markets 2013 Nov 04, 2013 - 12:13 PM GMTBy: Michael_Noonan

 Markets tend to rally during the last two months of the year, but like the indexes, that is a statement of averages, and averages do not always tell the whole story. It is not a secret that the Lying Ben schemers have been responsible for propping up the volume- deficient, individual-investor-absent stock market. What is of critical importance for any investor is to measure his/her portfolio against the overall market.
There have been some subtle signs of inner-working[s] market weakness of which any investor should be aware. Given that the central planners running this country have created a financial environment, via zero interest rate policies, that makes stocks one of the few areas in which to invest, one should be deeply suspect of their motivations. While there may be little incentive to hold cash, at times it is a preferable approach to preserve funds as opposed to putting them at risk in an artificial trading environment.
Seeking a return on investment is not always the best pursuit when getting a return of invested capital may be inviting too much risk exposure. What every investor should be doing, at this juncture, is measuring their individual stock performance to that of the averages. This goes to an important concept called relative strength. You always want to choose relative strength as a gauge for whatever choice is made in your stock portfolio.
The S&P and NASDAQ are measures of each respective stock universe. Any stock[s] you choose should be outperforming the averages, or be relatively stronger. If the stock indexes are performing better than your individual stocks, you may have a problem. In all likelihood, you do have a problem:dealing with underperformance, and that almost always translates in weak gains, at best, or more often, losses.
If you were to go to a racetrack, you want to bet on what you think will be the strongest and fastest horse. You would not go down the list of horses and pick out one that has been placing 5th, or worse, for the last several races. The same holds true for selecting a stock. Every once in a while, a fluke horse wins the race and pays off well, as a long shot, but when it comes to responsible investing, you want consistency in performance.
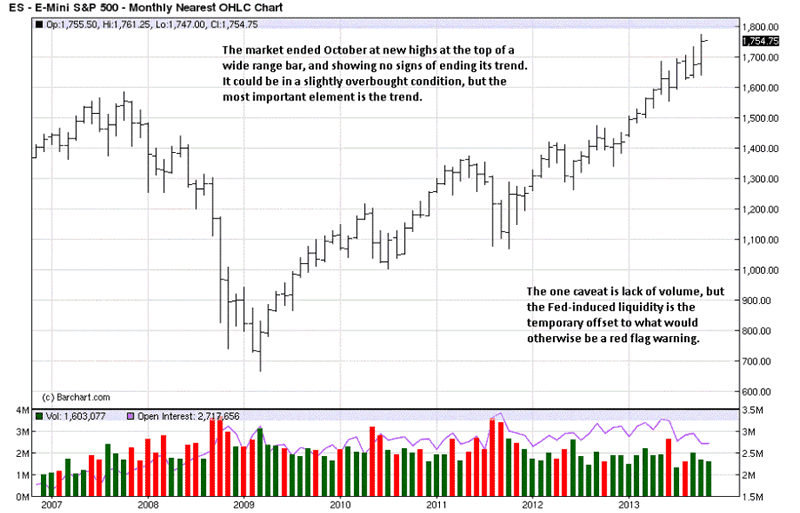
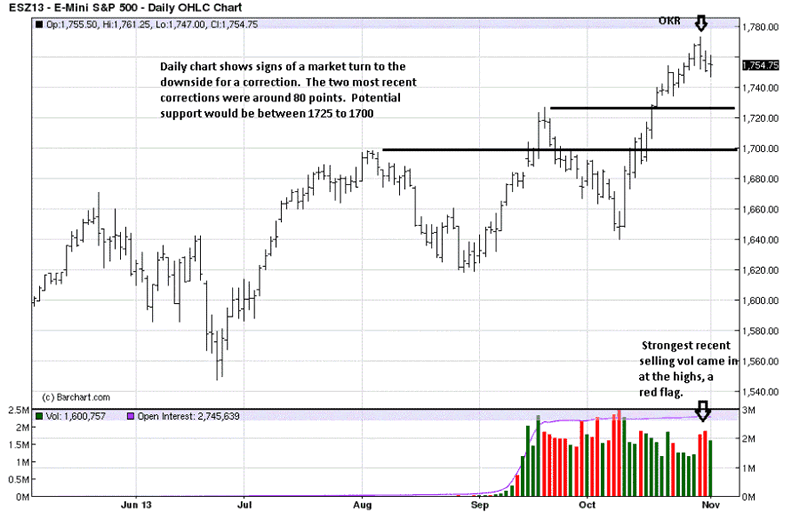
Here are the charts for the S&P and Nas. All time frames show an up trend, and when any market is showing such a strong trend, be long, preferably with stronger performers, but do not be short! More money is lost trying to pick tops and bottoms than at any other time in the markets. We will have more current details for the daily charts, at the end.
There is no question as to the exhibited market trend. The point to be made is that each of your existing individual stocks should be doing equally well, at a minimum. If not, three needs to be a close assessment for retaining them in your portfolio.
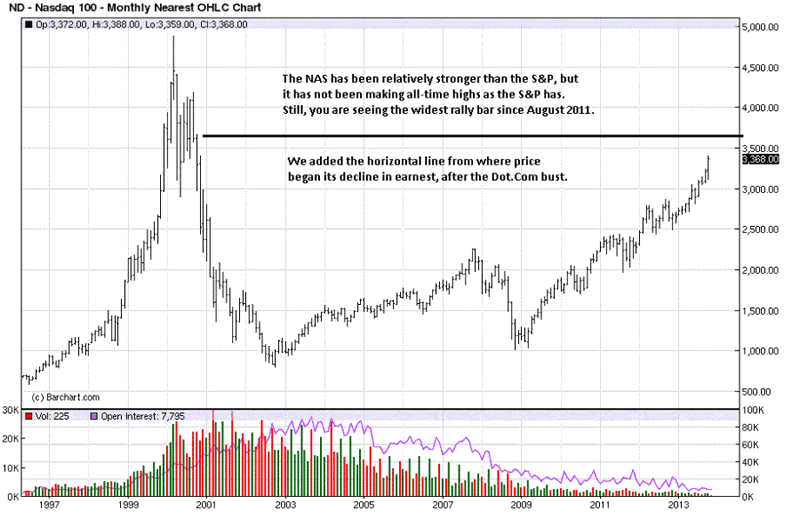
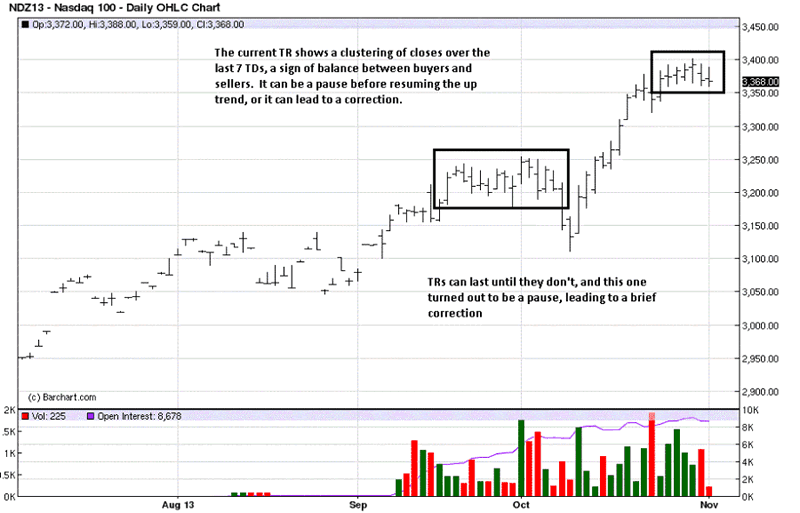
This index has been even stronger than the S&P, and any holdings within the NAS index should be at least as good in performance as this chart depicts. The chart includes more history to show that the NAS is not making all time highs, despite its relative strength.
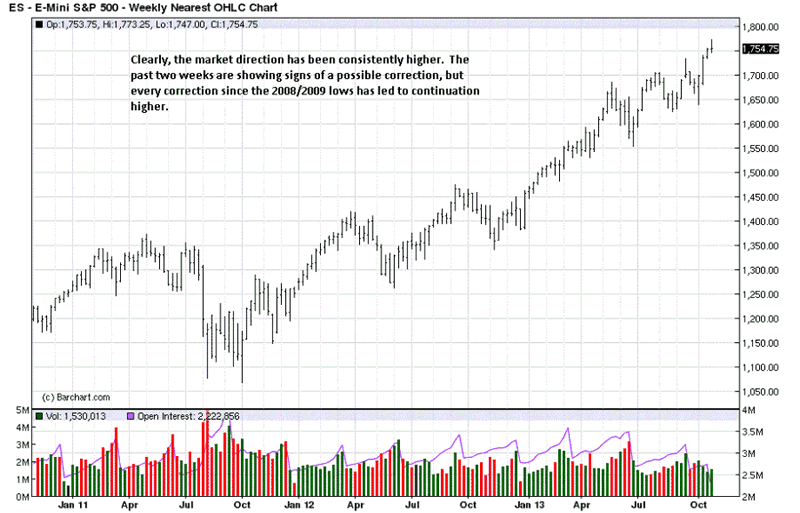
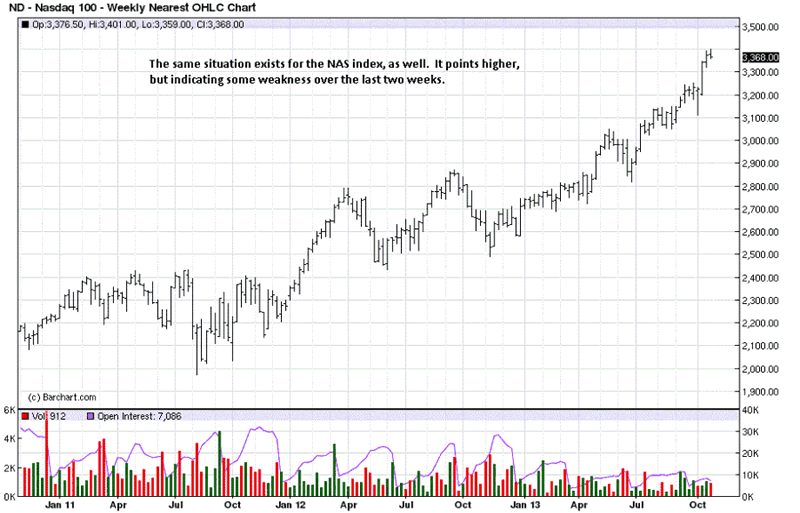
There are signs that a market turn, or a correction, could be forming. So far, every other market turn as provided a buying opportunity. Making that determination need not be done until we see if the market does correct, and the extent of the correction as it develops. In other words, we do not need to know or even guess until the event happens.
Small ranges at a high usually indicate demand has been spent, and sellers are meeting the effort of buyers and able to keep the market from extending higher, at least for now. There is no need to read anything further into this development. It is a warning to look for a correction, and even winnow out any/all weaker performing stocks.
Stock leaders have been struggling to hold their rallies, of late, and these are the ones that have been outperforming the indexes. When the leaders falter, it is a warning that a turn may be near at hand, and by a market turn, all we mean is a correction. It could turn into something more, but that has not happened, and there are no signs that it will be greater than a correction, at least not yet.
The leaders have been showing a tendency to correct while the indexes have reached there recent new highs. This is a divergence and a sign to be alert for potential change.
The relatively wider ranges of the last 3 bars is more typical of distribution by smart money holders, and the lack of leadership stocks to rally to new highs, at the same time as the indexes, adds to that assessment.
The current TR, [Trading Range], shows a form of upside stopping action. It may only be temporary, a resting spell before resuming the trend higher, or it may turn into a correction of some degree.
The list of NAS stocks making new highs is less than the number of new highs from previous new high occasions. The down volume is close to being greater than the up volume, and this rarely happens while a market is making new highs.
The breakouts of lesser-quality leadership stocks have been failing to carry through to the upside. These are lesser observable events by most investors, but they convey a message.
Now is the time to be doing some portfolio cleaning, getting rid of any and all stocks that have underperformed over the past few months. If they cannot respond well to market strength, they will do more poorly on the downside. If you have stocks that are showing minimal gains, or worse, a loss, this is the time to take action and reduce your exposure to further erosion of capital.
This is the message of the market. Cash may not be earning much, sitting idly, but you are not losing capital as you otherwise could when keeping it at risk in current market conditions. Keep relative strength uppermost in your mind. If your stocks are under- performing the market, why would you want to keep them? It is that simple a question.
By Michael Noonan
Michael Noonan, mn@edgetraderplus.com, is a Chicago-based trader with over 30 years in the business. His sole approach to analysis is derived from developing market pattern behavior, found in the form of Price, Volume, and Time, and it is generated from the best source possible, the market itself.
© 2013 Copyright Michael Noonan - All Rights Reserved Disclaimer: The above is a matter of opinion provided for general information purposes only and is not intended as investment advice. Information and analysis above are derived from sources and utilising methods believed to be reliable, but we cannot accept responsibility for any losses you may incur as a result of this analysis. Individuals should consult with their personal financial advisors.
Michael Noonan Archive |
© 2005-2022 http://www.MarketOracle.co.uk - The Market Oracle is a FREE Daily Financial Markets Analysis & Forecasting online publication.