


Have We Reached the Stocks Bull Market Top?
Stock-Markets / Stock Markets 2014 Nov 04, 2013 - 03:18 PM GMTBy: Andre_Gratian

 Current Position of the Market
SPX: Very Long-term trend - The very-long-term cycles are in their down phases, and if they make their lows when expected (after this bull market is over), there will be another steep decline into late 2014. However, the severe correction of 2007-2009 may have curtailed the full downward pressure potential of the 40-yr and 120-yr cycles.
Intermediate trend - SPX initial top in place.
Analysis of the short-term trend is done on a daily basis with the help of hourly charts. It is an important adjunct to the analysis of daily and weekly charts which discusses the course of longer market trends.
HAVE WE REACHED THE TOP? ...
Market Overview
... For some indices, probably. For the SPX, DOW, and NDX, perhaps not! I mentioned some time ago that I expected a minor top to form which would be followed by the final short-term uptrend. That minor top came at 1775 on SPX -- three points beyond the 1772 target I had in place since the 1646 low was confirmed - and the minor correction is under way. Although Friday saw an intra-channel bounce, there are some indications that it was only a rally in a downtrend and that the final minor low is still ahead. After that, we should experience the final up-phase of the bull market which will either re-test the tops, or make new highs in the indices listed above. The DOW has recovered and managed to eke out a fractional new high which was celebrated on CNBC last week. Indexes which tend to lead, such as RUT, experienced the most weakness in last week's correction.
The mood on Wall Street is very bullish, most individuals believing that as long as the Fed continues its purchases at the same rate, the market will continue to rise. Now that tapering has most likely been put off until next year, the bull market is expected to continue. According to the SentimenTrader: "Active fund managers have added to their exposure to stocks and are now carrying among their heaviest loads in 7 years".
Cycles, however, may be telling a different story and, if some of the more reliable cycle analysts are correct, the bull is on a very short leash. Also waving a red flag, sentiment indicators are reaching levels that are seen at important tops. If you are an investor, it's time to become wary!
Chart Analysis
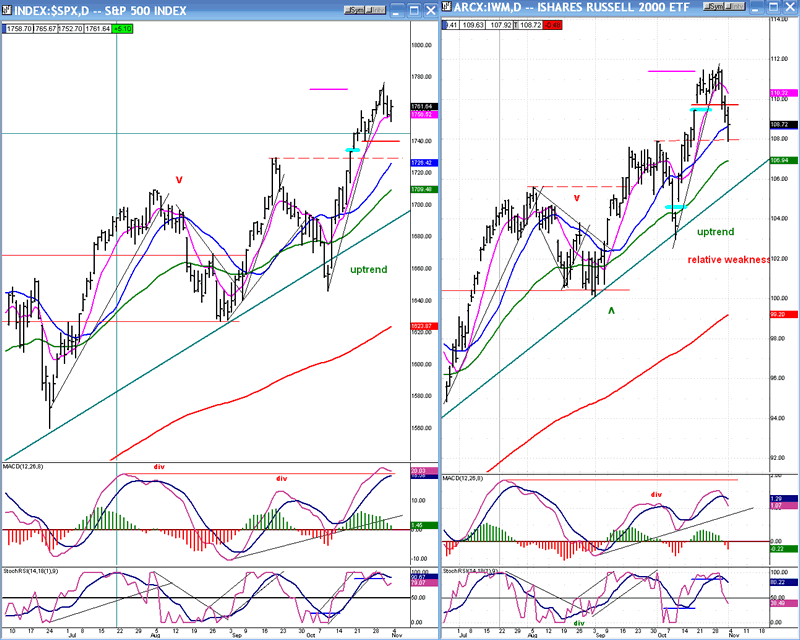
Even though the DOW is trying to catch up to the other indices, its relative performance is still very poor. This week, I want to focus on the relative performance of two other indices which, although it is in its early stages, could be just as significant as that shown in my last newsletter between DOW and NDX. The two indices to which I refer are SPX and the Russell 2000. (Here I show a chart of the IWM, but it changes nothing.)
Until last week, both SPX and IWM were merely skipping to new all-time highs in tandem. But when the first short-term correction since the beginning of October took place over the last three days, some significant change in behavior occurred. SPX had a well-controlled pull back of only 17% of its price rally while IWM, in sharp contrast, gave up nearly 50% of its comparable move.
That deserves notice! Granted, the time period is very short, and it's entirely possible that over the next week or two IWM will prove that this is nothing more than short-term volatility. But if it retains this newly found relative weakness, that will become a bright red flag!
The MACD alerted us to the coming weakness of the IWM. It did not keep up with the SPX and, in spite of the fact that it went slightly higher than its last peak, it remained below the previous one. Now the MAs have made a bearish cross and have started a downtrend, so the contrast with SPX is increasing.
For the short term, we now turn to the SPX hourly chart. After crawling its way up to the target level, SPX started its first worthwhile pull-back since the uptrend beginning at 1646. As of Friday's close,
prices were still contained within the channel that the correction has created. Friday also saw a minor bounce take hold which reached the top of the channel. If we open up on Monday, this could set up the index for its last uptrend of the bull market. But the A/D oscillator especially, which is still negative, could only create a flat pattern during this bounce. So there is a good chance that this is all it was and that some additional correction will be needed before we can start on the next short-term uptrend.
What that uptrend will consist of remains to be seen. Will the SPX make a new high, or will it simply test the former high and stop there? We will have a better idea when this minor correction is over.
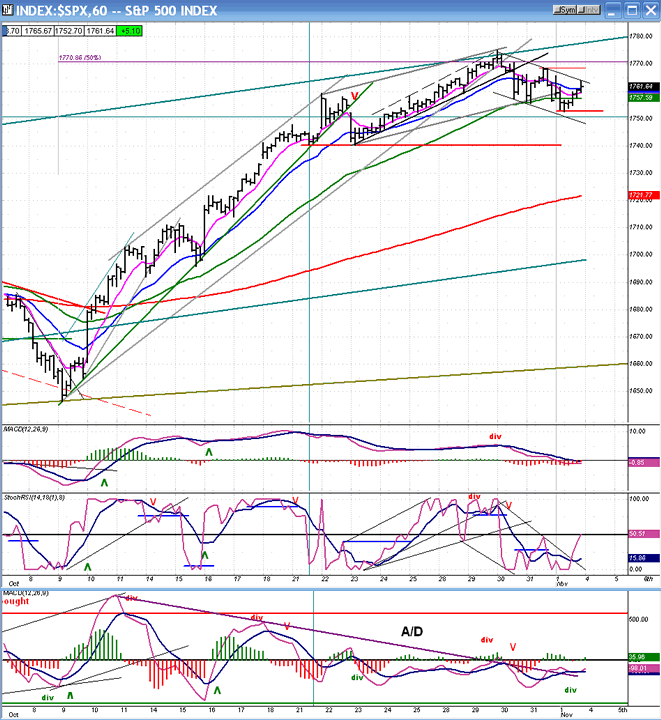
While the daily MACD showed a lot of strength by making a new high, that was not the case with the hourly MACD which clearly showed some obvious negative divergence at the top. The A/D oscillator, however, gave warning about an imminent reversal in both the daily and hourly components. To a great extent, the latter will also have a great deal to say about the inner strength of the final up-phase.
Cycles
A cluster of topping cycles is being predicted for the second week in November (next week), perhaps extending early into the third. It does not give much time for another uptrend to start and complete.
A market top in this time frame would probably mean that the long-term cycles (30-yr, 40-year, 120-yr) due to make their lows a year from now are finally taking over.
Breadth
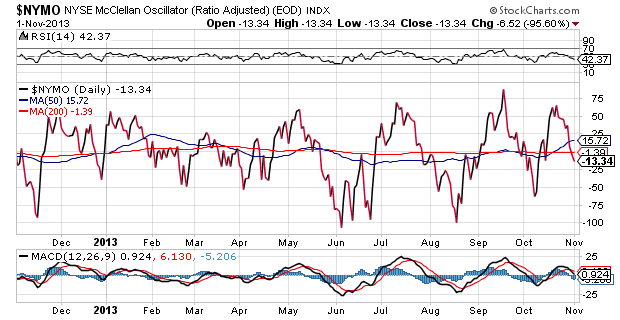
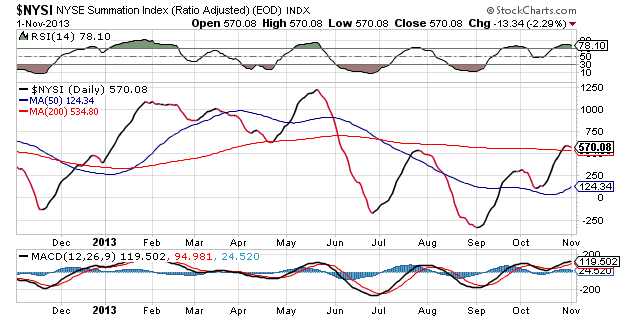
The McClellan Oscillator and Summation Index appear below (courtesy of StockCharts.com). The NYMO reflects the market short-term weakness by peaking lower than its last high, while SPX was making a new high. Intermediate-term weakness is very obvious in the NYSI, with an overbought RSI to boot.
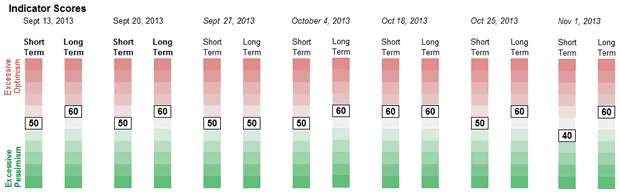
Sentiment Indicators
The SentimenTrader (courtesy of same) long term indicator closed the week at 60, but on two consecutive days last week, it hit 70, the reading I had been expecting as an indication of the market top. I would expect it to return to that number as the last minor uptrend gets under way.
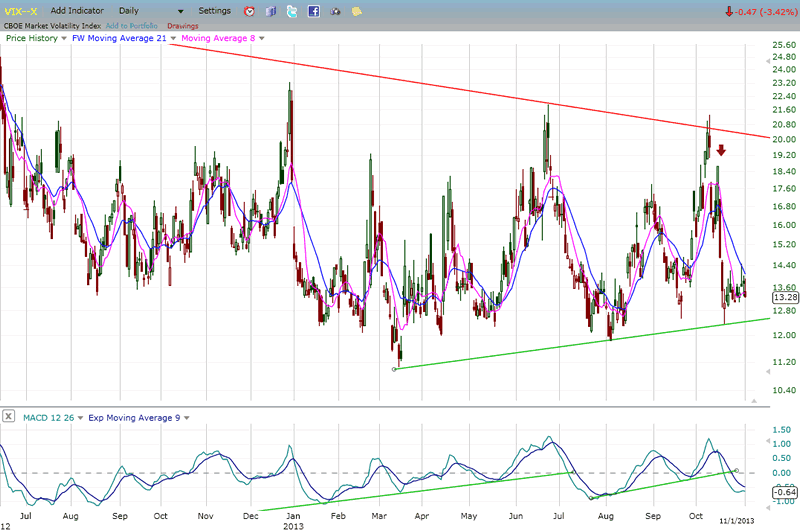
VIX
In the course of next week, VIX is expected to retain its positive divergence while it makes the final preparations for a reversal.
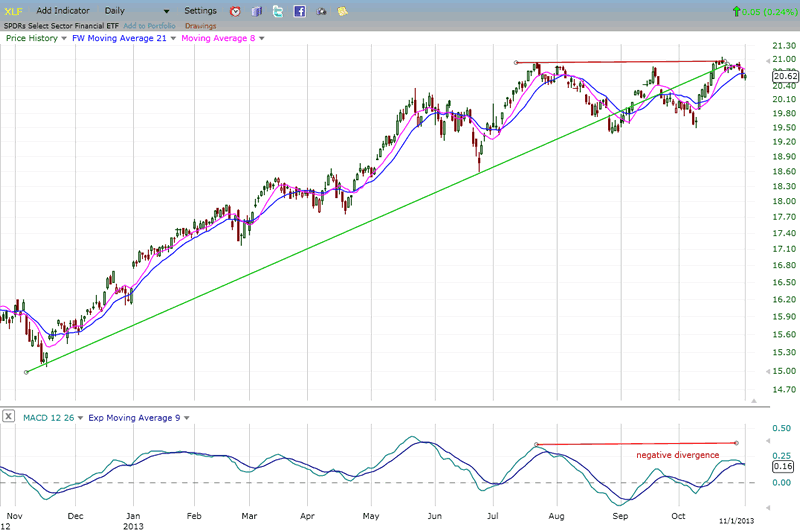
XLF (Financial Index)
XLF is a lead indicator and its behavior at an approaching top denotes relative weakness to SPX. This is clearly what is taking place right now. But XLF is not an isolated case. Other leading indexes and indicators are also issuing warnings that a reversal is near.
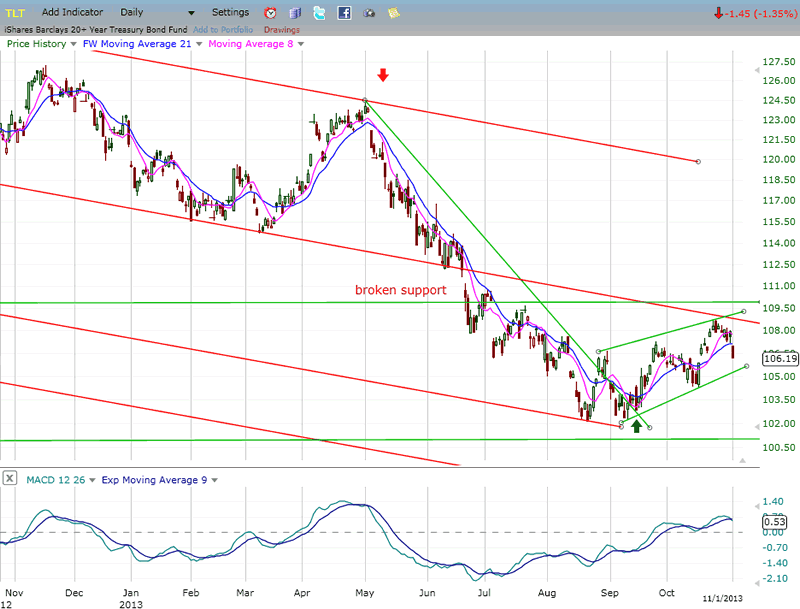
BONDS
I had expected TLT to meet with resistance when it reached the red trend line which marks the middle of its long-term corrective channel. This is what has happened and if it cannot stay above the short-term (green) trend line, it is likely to retrace all the way to the previous low. Before it can have a serious reversal, it will have to build a larger base. The index has filled the count that it developed at the 120 level. This means that it could remain in this area for some time, preparing for a better rally. Or, if this is a pattern of re-distribution, it could be getting ready to extend its long-term downtrend.
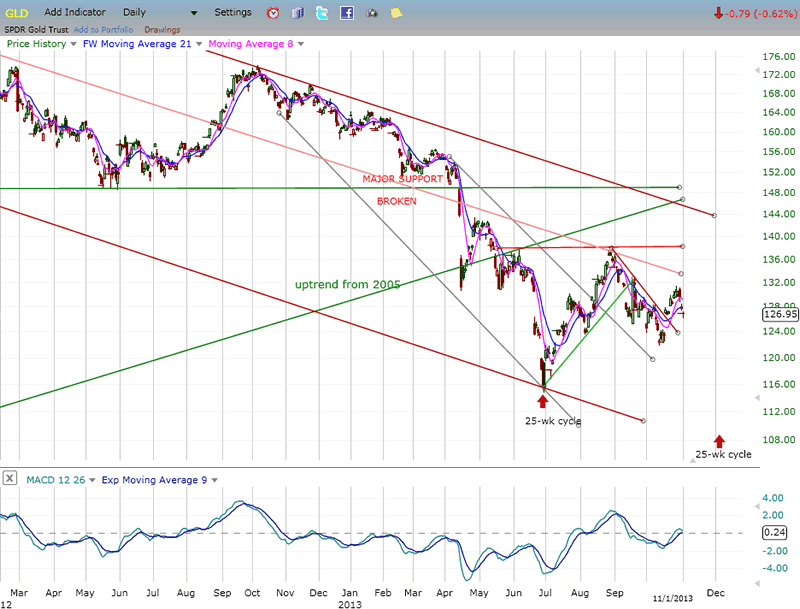
GLD (ETF for gold)
As anticipated, GLD's attempt at rallying was short-lived, stopping at its lowest target of 131 instead of moving up to its potential of 135 or a little higher. This is undoubtedly due to the fact that its next 25-wk cycle is due in the first week of December and fast approaching. A long-standing target of 110 could be met on this cycle low.
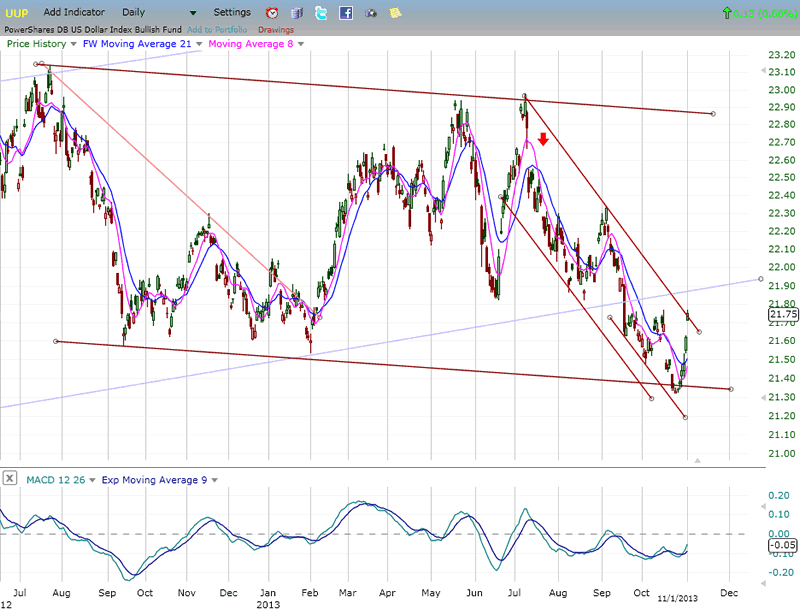
UUP (dollar ETF)
Last week, I ventured the opinion that UUP could find support at the bottom of its larger correction channel, noting that a deceleration process was taking it farther and farther away from the bottom line of its short-term channel. Last week was reversal week -- precisely from the bottom of the larger channel with an immediate challenge to the declining shorter channel. Note that GLD and UUP reversed exactly at the same time in an inverse manner. If the 25-wk low of GLD corresponds to a high in UUP, we should witness confirming strength in the dollar over the next few weeks.
USO (United States Oil Fund)
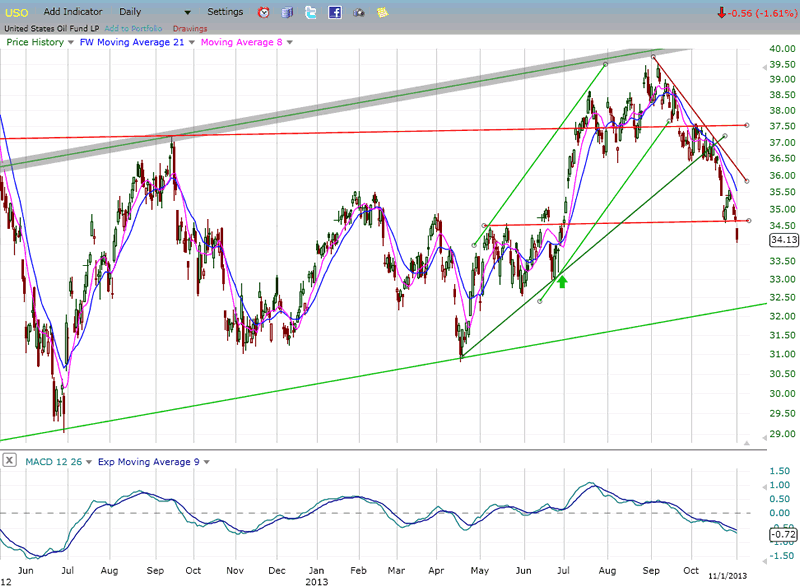
Last week, I suggested that USO needed to hold above its support line, or it would risk declining all the way to the bottom of its green channel. It looks like this has become a real possibility. The question now is: "Will it stop there?
Summary
Being conscious of the long-term cycles due to bottom around October 2014, I have been on the lookout for signs that they were taking hold on the market. Frankly, I had expected them to do so at a much earlier date, but I suspect that the Fed policy had much to do with prolonging the bull market.
Now, however, unmistakable signs are appearing that the cyclic downward pressure into the end of 2014 can no longer be held back. A number of leading indexes and indicators are beginning to issue warnings and it is an investor's last chance to heed them. If you need a little proof, you can wait for the decline to actually start. That's up to you. This is the time for greater objectivity than ever.
FREE TRIAL SUBSCRIPTON
If precision in market timing for all time framesis something that you find important, you should
Consider taking a trial subscription to my service. It is free, and you will have four weeks to evaluate its worth. It embodies many years of research with the eventual goal of understanding as perfectly as possible how the market functions. I believe that I have achieved this goal.
For a FREE 4-week trial, Send an email to: ajg@cybertrails.com
For further subscription options, payment plans, and for important general information, I encourage
you to visit my website at www.marketurningpoints.com. It contains summaries of my background, my
investment and trading strategies, and my unique method of intra-day communication with
subscribers. I have also started an archive of former newsletters so that you can not only evaluate past performance, but also be aware of the increasing accuracy of forecasts.
Disclaimer - The above comments about the financial markets are based purely on what I consider to be sound technical analysis principles uncompromised by fundamental considerations. They represent my own opinion and are not meant to be construed as trading or investment advice, but are offered as an analytical point of view which might be of interest to those who follow stock market cycles and technical analysis.
Andre Gratian Archive |
© 2005-2022 http://www.MarketOracle.co.uk - The Market Oracle is a FREE Daily Financial Markets Analysis & Forecasting online publication.