


Stock Market Closing In on Primary Wave III
Stock-Markets / Stock Markets 2013 Nov 18, 2013 - 08:19 PM GMTBy: Andre_Gratian

 Current Position of the Market
SPX: Very Long-term trend - The very-long-term cycles are in their down phases, and if they make their lows when expected (after this bull market is over), there will be another steep decline into late 2014. However, the severe correction of 2007-2009 may have curtailed the full downward pressure potential of the 40-yr and 120-yr cycles.
Intermediate trend - Important top formation is in the making.
Analysis of the short-term trend is done on a daily basis with the help of hourly charts. It is an important adjunct to the analysis of daily and weekly charts which discusses the course of longer market trends.
CLOSING IN ON PRIMARY WAVE III
Market Overview
We have arrived at the time frame when, according to cycle analysts, multiple cycles are topping. That was written last week! Obviously, the cycle highs have shifted to the right in a process known as "right translation", but they have not been invalidated.
In what moves the market, it is often difficult to distinguish which is the chicken and which is the egg, but at some point technical, structure, sentiment, and reaction to the news background all coalesce to bring about a reversal of the trend. Last week, the confirmation hearings for Janet Yellen, and her expressed desire to continue the current bond purchase program until the economy exhibits more strength created another wave of speculative buying which resulted in changing the topping pattern from an ending diagonal to a supplemental 5-wave pattern. Because this structural change took place, it becomes more likely that we are only in the process of making an intermediate top, and that the bull market will have another high after this intermediate correction has been completed.
The current short-term pattern is also incomplete and will require a minor correction followed by one more minor wave up to reach the top of primary wave iii. This is the perspective expressed by Tony Caldaro, and the technical and sentiment condition of the market supports his view. I will discuss these in the forthcoming analyses. While the 1775 projection put a lid on prices for a little over two weeks, they finally overcame that level's resistance -- that is, all major indices except for the Russell 2000 which was unable to make a new high. Of course, it could still do it during the 5th and final wave completing primary III. But even so, the divergence with the other indices will most likely remain in place.
Also interesting is that NDX only exceeded its former high by 14 points, thereby appearing to lose some of its upward momentum. We'll have to see how it behaves during the rest of the market action which is required to complete the top.
After a temporary stall, the DOW found new life and has been a good performer during the past week.
Chart Analysis
We'll start with SPX daily chart (courtesy of QCharts). I am only showing the last 6 months of the uptrend so that we can better concentrate on what is happening today. After reaching the 1975 projection, SPX started a trading pattern which, as it progressed, began to look bearish. That appearance was dispelled three trading days ago when the index refused to break its trend line and went on to make a new high, adding to the structure another (and probably final) short-term bullish impulse wave. Best guesstimate is that we are now in the process of completing wave 3 of the new phase, but that will become more obvious when we analyze the hourly chart.
Some of the cycles projected to top in this time frame were able to contain prices for a little while, but enthusiasm about the near certain appointment of QE advocate Janet Yellen as the next chairman of the Federal Reserve temporarily delayed the influence of some of the longer-term cycles. I do stress temporarily, because these cycles should eventually overcome this last wave of bullishness.
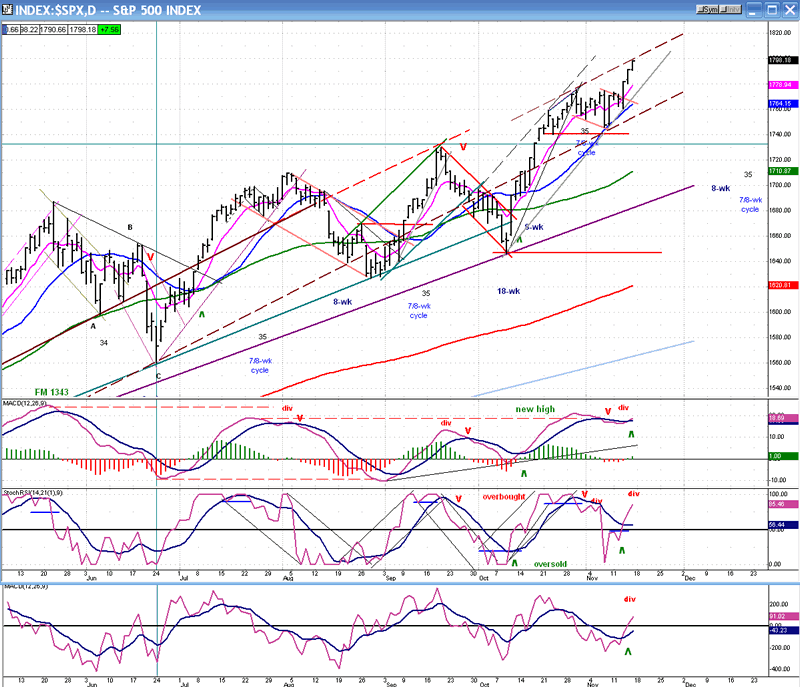
If you have some doubt about the market condition, take a look at the oscillators. They all turned up with the resurging strength, but every one of them shows negative divergence, which is most pronounced in the bottom (A/D) indicator -- as it should be.
How long do we have till the top? Probably a week to ten days. By then, the bullish enthusiasm will have subsided, the structure should be complete, increased warnings should come from the already elevated sentiment indicators, and the market leaders should be clearly lagging. If this does not happen, then something is wrong with the analysis and we should wait for clarification.
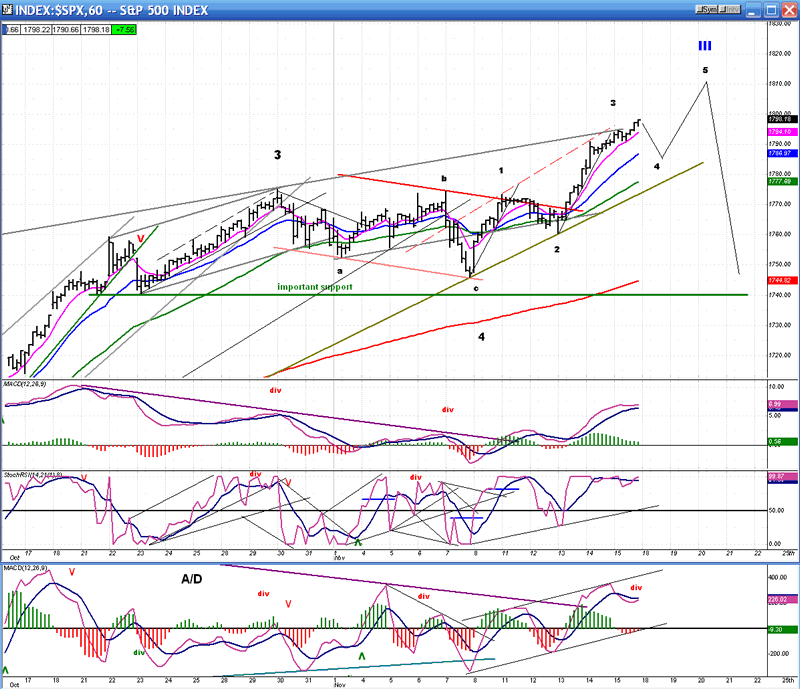
Let's move on to the short-term and look at the hourly chart (also courtesy of QCharts). I have labeled the chart phases according to the current EW consensus with which most analysts agree -- but only over the short term. There is disagreement over the long term structure. If the analysis is correct, one final near-term correction should be followed by a final minor wave up to the top. (The price pattern will not necessarily follow exactly the graph that I have provided on the chart.)
The hourly oscillators appear to bear out this analysis. They provide evidence that wave 3 is either over, or just about. The middle one has now been overbought for 3 days, the MACD has flattened out and appears to be ready for a bearish cross, and the A/D has already crossed and shows negative divergence. We'll have to monitor the extent of the correction when it is underway to see if it coincides with the normal Fibonacci possibilities. This short-term correction should not last more than a few days.
We'll pick-up this analysis in another week's time to see if the market action has conformed to the forecast.
Cycles
The cycles forecast made over the past couple of weeks which called for a top has been postponed by the conditions discussed above. If the current analysis is correct, it is likely that cyclic conditions will re-take control of the market in about a week. The difference being that, as a result of the current structure, this will more likely be an intermediate top than the top of the bull market. If they are not able to start influencing the market now, the long-term cycles bottoming in October 2014 will not be put off forever.
The next 8-wk cycle due in mid-December (helping to create a top of sorts in the near future) should be closely followed by the 7-8 week cycle.
Breadth
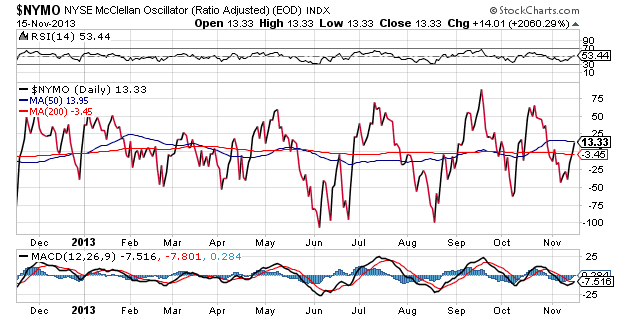
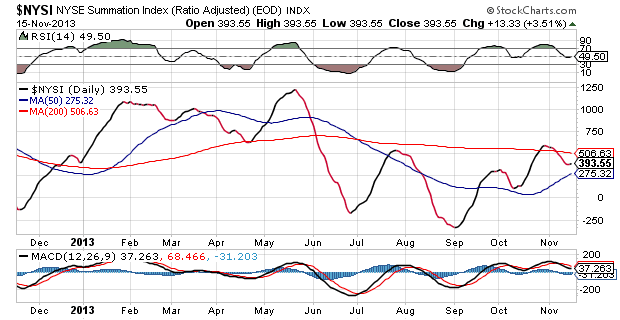
The McClellan Oscillator and the Summation index (courtesy of StockCharts.com) have not changed a great deal over the past week. The McClellan Oscillator had a rally which only took it to just above the zero line -- not exactly a sign of super momentum. NYSI turned up almost unperceptively while most indices were making new highs.
If we are to move much higher than the above analysis indicates, it will take much more positive momentum from the A/Ds, and this would send the NYSI decisively above its 200-DMA. That does not appear to be in the cards, especially since we are expecting to see a short-term correction before the market goes much higher - possibly as early as Monday.
Sentiment Indicators
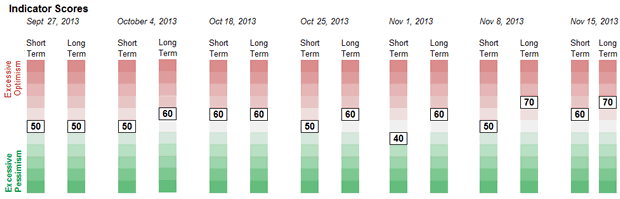
The SentimenTrader (courtesy of same) long term indicator closed at 70 for the second consecutive week. That, too, is a warning that we are getting closer and closer to the top of this move. It is even possible that we could see a reading of 80 by the time we get to the top - unless that is reserved for the top of the bull market.
VIX
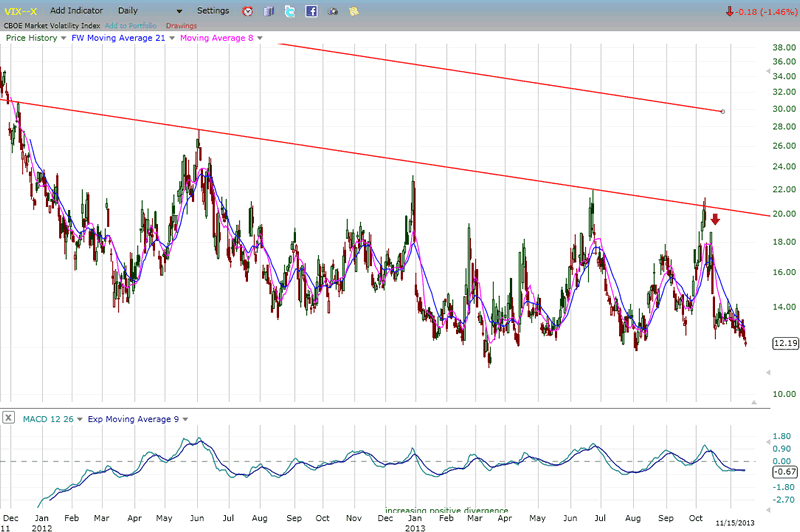
As the market rose to new highs, VIX made a short-term new low but remained above its August low, thereby retaining its positive divergence to recent market tops. In the past couple of weeks, the MACD flattened out in spite of the near-term decline and that could mean that the index is again about to turn around. However, more work will be needed before it is ready to start another uptrend, but it should have at least a week to 10 days prepare for that. Let's see what it looks like by next week.
XLF (Financial Index)
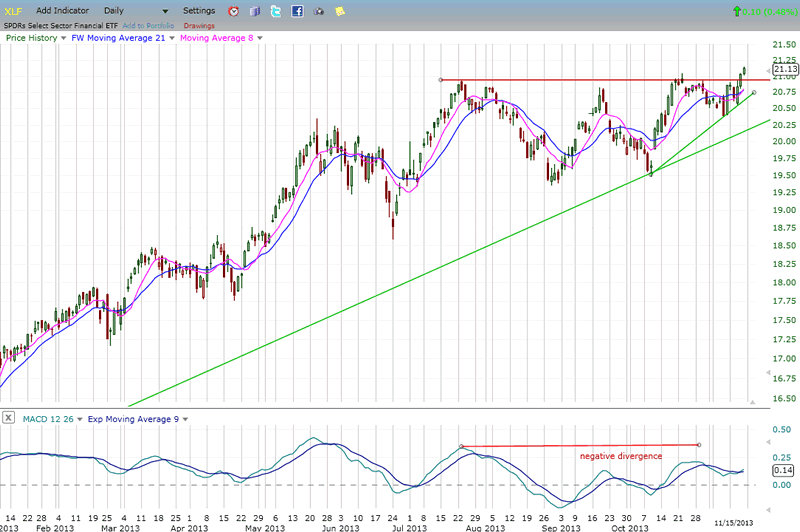
XLF found a new supply of energy which helped it make a new bull market high. While it is still lagging SPX, the fact that it is not showing more relative weakness is probably another clue that we are only establishing an intermediate top and not the end of the bull market. In 2007, the divergence that it displayed was far more pronounced and began several months before the top. There is no similarity this time. However, its relative weakness to the SPX over the long term is very severe and should not be discounted in our longer-term market analysis.
BONDS
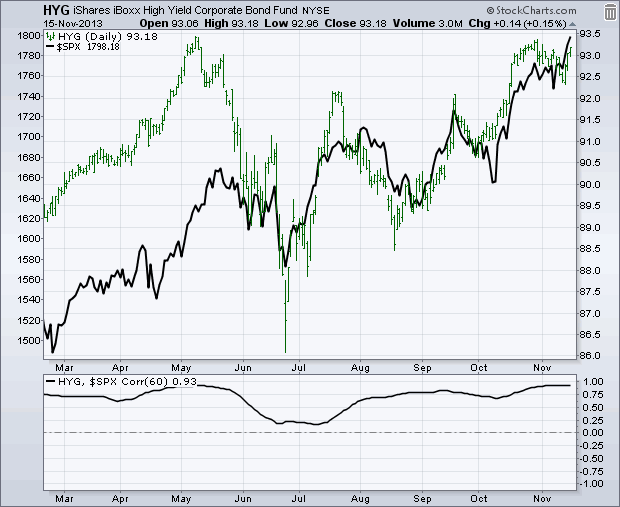
Instead of analyzing TLT, this week, I want to show you a chart of high-yield corporate bonds with an overlay of the SPX (black) (courtesy of StockCharts.com). According to John Murphy, this bond fund tends to top before SPX. This was the case in May and July while September showed synchronized action. In the past month, these bonds started to move down and underperform SPX. Although they rallied in the past three days, they have not exceeded their highs, while SPX has, and by a good margin. We'll be watching how they trade over the next week.
GLD (ETF for gold)
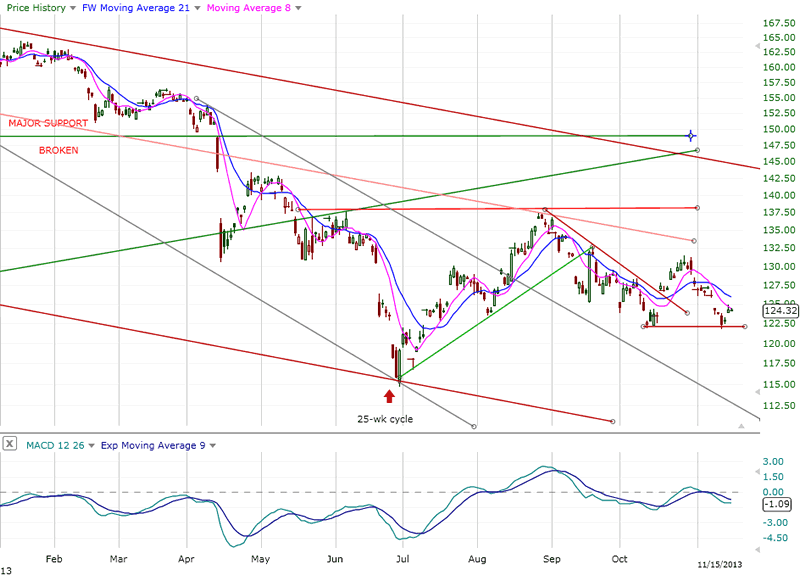
GLD's chart continues to deteriorate, giving credibility to the view that its bottoming 25-wk cycle is exerting more and more pressure on gold. If this continues over the next 4 to 6 weeks (into the cycle low), GLD could easily make a new low in its long-term downtrend. Breaking the red support line which represents the level of the last short-term bottom would confirm the analysis.
UUP (dollar ETF)
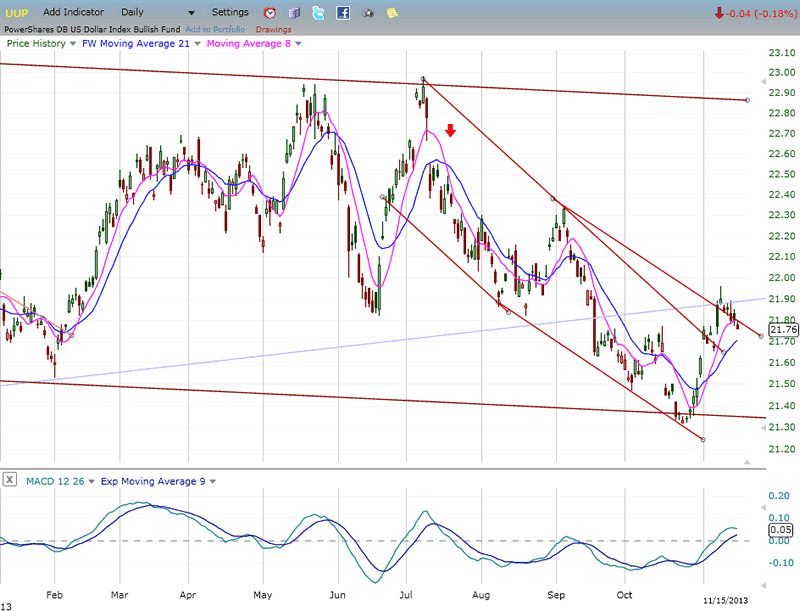
UUP underwent some consolidation in the past week. Its down-channel has become slanted to a lesser degree with UUP finding temporary resistance at the top of the new channel, but it has already breached it and it's only a matter of time before it starts to trade outside of it.
UUP's action is exactly the reverse of GLD over the short-term and it's a pretty good bet that it will continue to rally as GLD continues to decline into the low of its 25-wk cycle.
OIL- WTIC (spot oil - EOD)
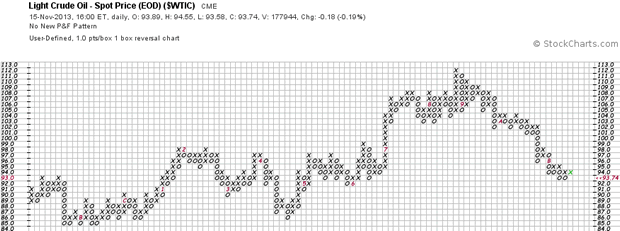
This week, instead of looking at USO, we'll look at the P&F chart of WTIC. This is a chart which "counts" very well, so it is relatively easy to establish projections for the index's next move.
At its last low, WTIC had created an apparent inverse H&S pattern which, if it had been confirmed, would have taken the price of oil much higher than it did. Instead, it stopped at 112, which is exactly the count which was established at the 95 level of the "right shoulder". Now, after creating a distribution top, a count taken across the 107 level has a projection target to 86.
The purchase of any oil-related security should probably be deferred until that objective has been met.
Summary
In the past week, the SPX showed its propensity for going higher as its structure shifted from a potential ending diagonal to a final fifth wave, which should end the rally from October 2011 by completing primary wave III. This change of structure now favors an ensuing primary wave IV correction of intermediate nature instead of a bull market top.
Cycle tops appear to have shifted to the right in what is known as "right translation". All the divergences and other characteristics of an important top remain in place.
FREE TRIAL SUBSCRIPTON
If precision in market timing for all time framesis something that you find important, you should
Consider taking a trial subscription to my service. It is free, and you will have four weeks to evaluate its worth. It embodies many years of research with the eventual goal of understanding as perfectly as possible how the market functions. I believe that I have achieved this goal.
For a FREE 4-week trial, Send an email to: ajg@cybertrails.com
For further subscription options, payment plans, and for important general information, I encourage
you to visit my website at www.marketurningpoints.com. It contains summaries of my background, my
investment and trading strategies, and my unique method of intra-day communication with
subscribers. I have also started an archive of former newsletters so that you can not only evaluate past performance, but also be aware of the increasing accuracy of forecasts.
Disclaimer - The above comments about the financial markets are based purely on what I consider to be sound technical analysis principles uncompromised by fundamental considerations. They represent my own opinion and are not meant to be construed as trading or investment advice, but are offered as an analytical point of view which might be of interest to those who follow stock market cycles and technical analysis.
Andre Gratian Archive |
© 2005-2022 http://www.MarketOracle.co.uk - The Market Oracle is a FREE Daily Financial Markets Analysis & Forecasting online publication.