


Stock Market Top - Bear Market Forecast 2014 to 2016
Stock-Markets / Stocks Bear Market Dec 23, 2013 - 10:05 AM GMTBy: Toby_Connor

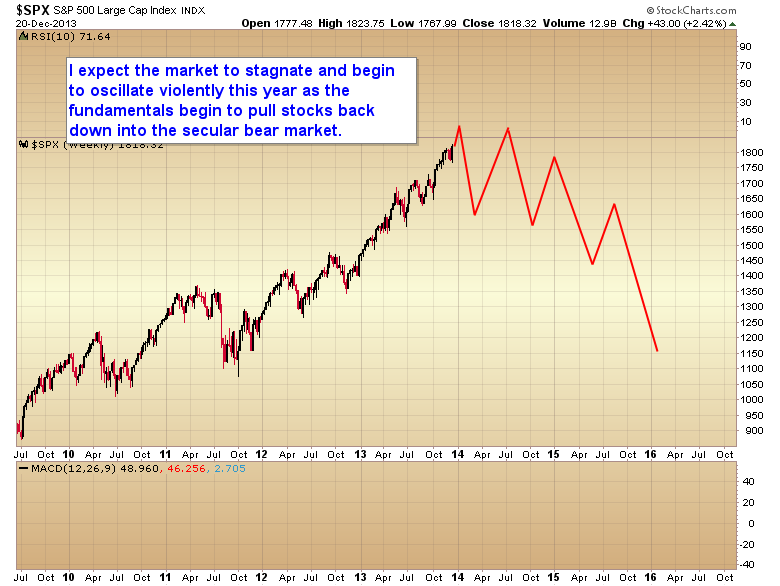
 It's been my theory for some time now that this QE driven bull market would top either in late 2013 or early 2014, followed by a multi-month stagnation process as liquidity leaked into the commodity markets.
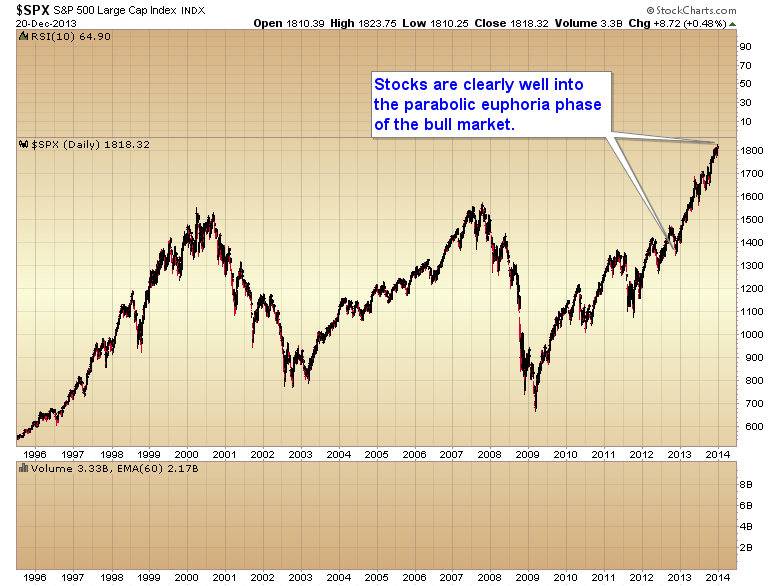
At almost 5 years this bull market is right up there with the three longest bull markets in history. Sentiment and complacency have reached levels typical of a bull market top. We are clearly well into the final parabolic euphoria phase of the bull.
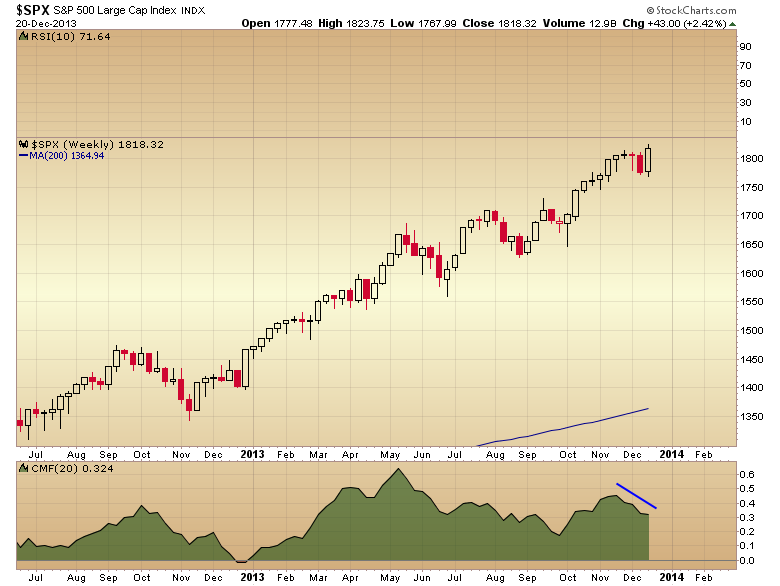
The Advance-Decline line has started to diverge.
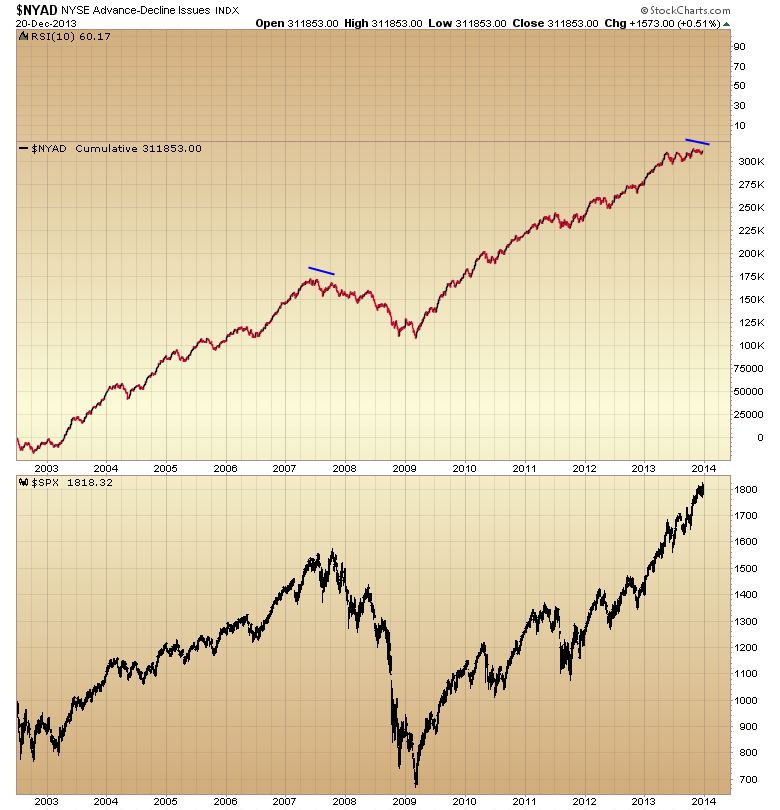
Market breadth is deteriorating; this often happens at intermediate tops.
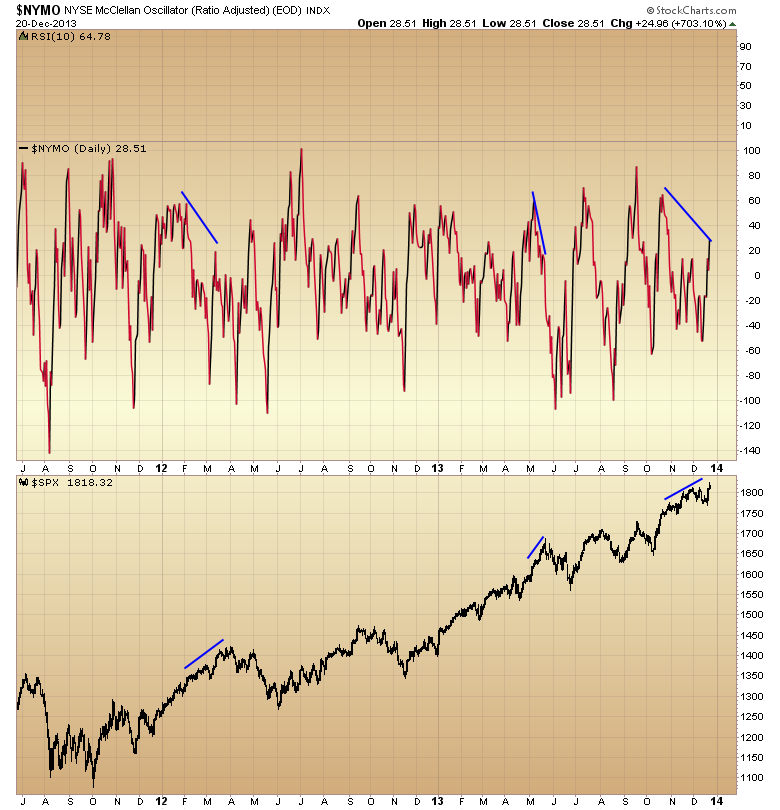
Money flows are also diverging. Another warning sign that is often seen at intermediate tops.
Even more concerning is the fact that this intermediate rally will be on week 27 next week. Most intermediate cycles bottom by week 20-24. QE 4 is stretching not only this intermediate cycle, but the previous intermediate cycle before it. This has in effect stretched the market extremely far above the mean, guaranteeing an exceptionally violent decline when this house of cards breaks. The Fed hasn't done us any favors by artificially pushing the market much higher than it should've gone naturally. All they have done is guarantee an exceptionally severe selloff when the market finally corrects.
We've clearly been in the euphoria phase of this bull market throughout 2013, and I expect this will continue through the end of the year and maybe into the beginning of earnings season. However, I expect we are going to see a very sharp move down in stock prices as we move through January and into early February.
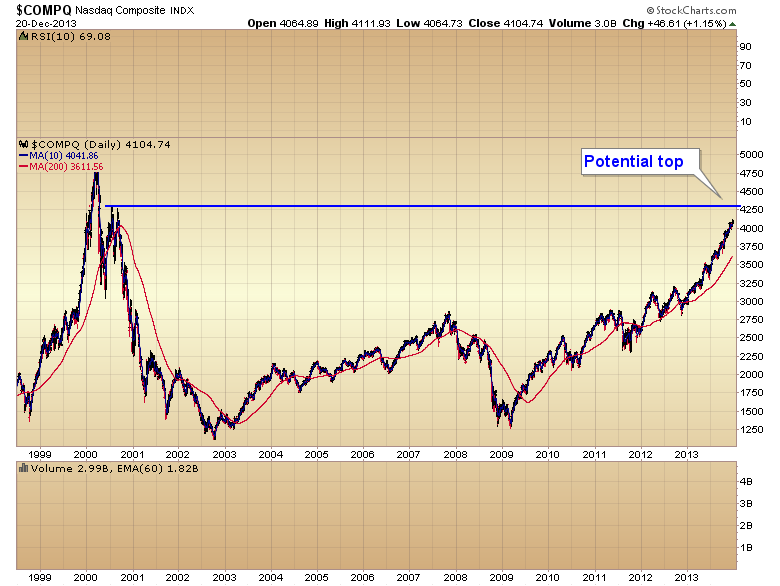
For those inclined to enter short positions or long term put positions in preparation for the next bear market, I think they could do so when and if the NASDAQ reaches its initial 2000 recovery high of 4250.
I think 2016 puts on the QQQ or SPY are going to pay off many thousands of percent over the next two years.
The $1 two day trial is still active. Click here to sign up for the trial and read the latest daily report.
Toby Connor
Gold Scents
GoldScents is a financial blog focused on the analysis of the stock market and the secular gold bull market. Subscriptions to the premium service includes a daily and weekend market update emailed to subscribers. If you would like to be added to the email list that receives notice of new posts to GoldScents, or have questions,email Toby.
© 2013 Copyright Toby Connor - All Rights Reserved
Disclaimer: The above is a matter of opinion provided for general information purposes only and is not intended as investment advice. Information and analysis above are derived from sources and utilising methods believed to be reliable, but we cannot accept responsibility for any losses you may incur as a result of this analysis. Individuals should consult with their personal financial advisors.
Toby Connor Archive |
© 2005-2022 http://www.MarketOracle.co.uk - The Market Oracle is a FREE Daily Financial Markets Analysis & Forecasting online publication.