


Gold Price Has Bottomed
Commodities / Gold and Silver 2014 Jan 07, 2014 - 04:57 AM GMTBy: Thomas_Clayton

 Words by different Authors who attempt to “Pump Up” or “Talk Down” an Issue are exactly that, just Words. The ultimate results show up on Technical Charts in relation to Volume and Price Movements and which act as a Function of Mathematical Indicators involving Momentum and Rate of Change as we learned in Algebra II in H.S. and Calculus and Derivatives at U.C. Berkeley. There should be no “Mystery” in making money if these concepts are applied correctly which involve the Net Emotions of Greed and Fear and the Fundamental Values will ultimately take care of themselves. By applying correctly, Have Cash Ready until you see MACD lines crossing Up or Down at ZERO and always use Stops to Limit your losses. If you are an Intraday Trader, use 1min to 15min Charts and look for Peaks and Troughs of %B to Alert you and MACD line Crosses to Effect a Buy or Sell. If a “Long Termer”, which does not exist with Volatile ETFs, use Daily Charts.Follow me and stockcharts.com and you will see. Initially use the format: “chartbook” and scroll to the issues which are of interest specifically to your style of “Investing or Speculation”, and if you wish to make some good Returns for a Change as many of my Followers. Thank you for your interest
RULES: Jan 05th, 2014, Last week I Marketoracle published my Charts that Gold had Probably bottomed. This is a FollowUp to that report I never used to give much attention to MACD because the defaulted parameters given never lined up, until I substituted Fibonacci numbers 13,21,8 and multiples thereof, lined up directly PRECISELY at very peak tops and trough bottoms.
Coincide that first with Stochastic RSI above 0.2,
%B Trough,
Slow Stochastics above 20, MACD lines crossing Up, and confirmed by MACD lines crossing above Zero has given me the most ACCURATE, alert that an Issue has bottomed almost at the precise Lowest Price. A Sell signal is expressed with
Stoch RSI passing below 0.2, Slow Stoch below 20,
%B Peak,
MACD lines crossing down with confirmation of MACD lines crossing below Zero.
All these Indicators must happen or there is NO Buy or Sell Signal.
Each time frame from 1 minute to Monthly have their own characteristics, so by observation you will find the uniqueness in each Time Frame in relation to the Indicators. I repeat, BE IN CASH until you see MACD lines crossing Up or Down at ZERO and always use Stops to Limit your losses. If you are an Intraday Trader, use 1min to 15min Charts and look for Peaks and Troughs of %B to Alert you and MACD line Crosses to Effect a Buy or Sell. If a Long Termer, which does not exist with Volatile ETFs, use Daily Charts. See the Maximum and Minimum Values when the Area Between the MACD lines are at their Maximum and start to Contract and then Expand denoting a change in Direction.
Questions: stemsmexico@gmail.com skype: stemsmexico3 better than telephone and is Free.
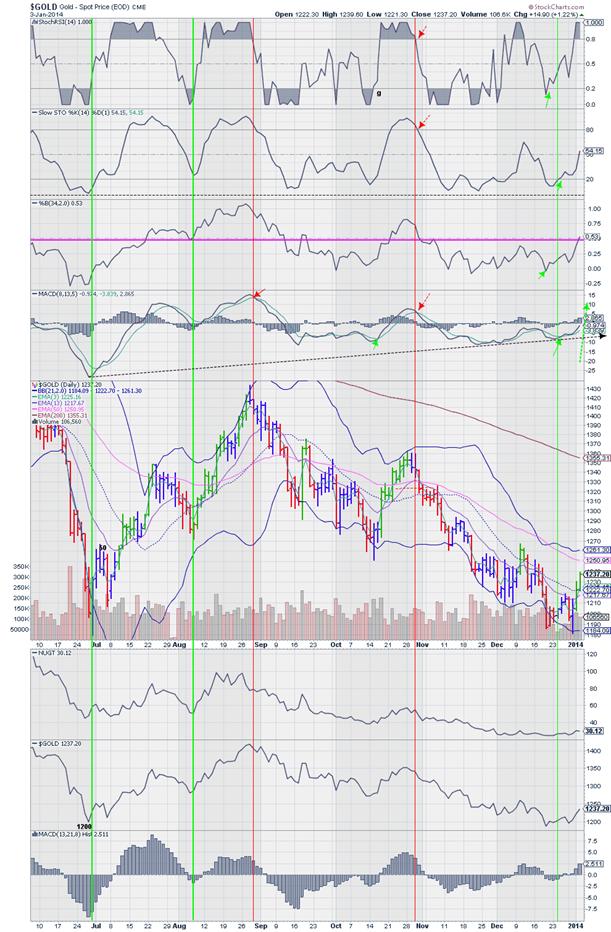
GOLD DAILY, 6 MONTHS, courtesy of stockcharts.com. Cross Up by MACD above Zero will Confirm.
GDX Gold Miners 15min courtesy of stockcharts.com- 15min seems to be the best for timing
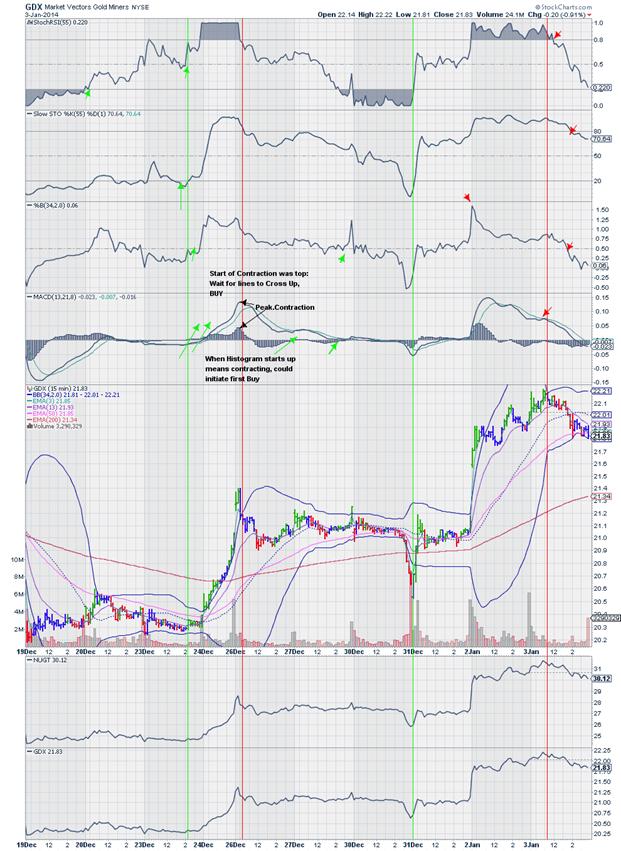
Dec 31 Buy, Red Vertical, Jan3rd, %B Peak, Stoch RSI 0.8, Slow Stoch 80, MACD Line cross Down, Peak in Price then %B Below 50. Now wait for %B to Trough for Next Cycle Up. When will that be?—We then go to the 1 minute Chart
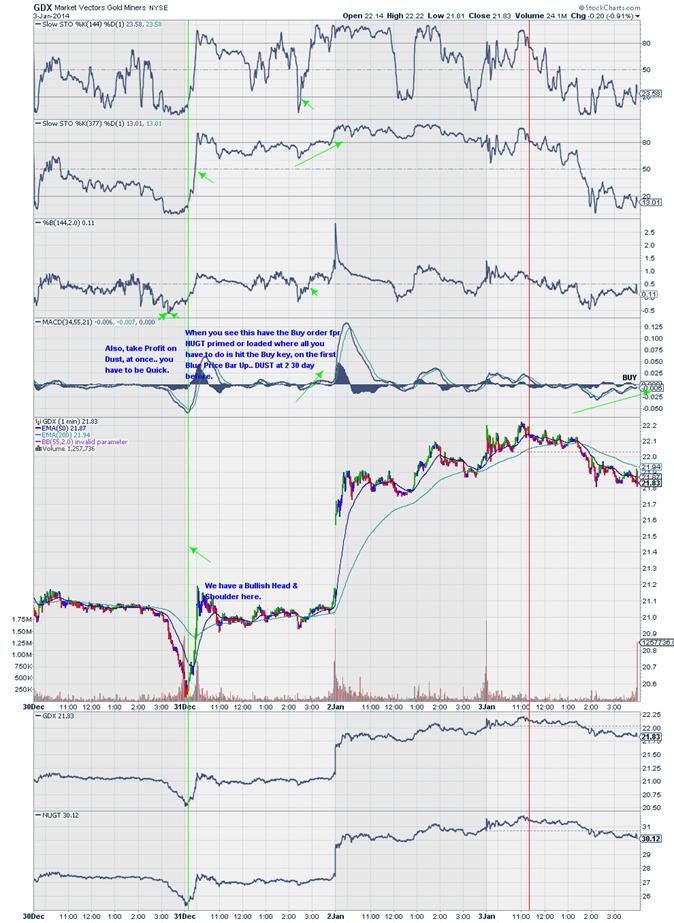
GDX 1min—more subjective and a bit “whippy” Stand back and watch Indicators, particularly the MACD. We are now waiting for MACD lines to cross above Zero to continue the Uptrend. When MACD crosses Zero, all time frames will do in unison.You can see Indicators crossing above the “Triggers”. Have Buy order for NUGT loaded and ready to strike “Buy” when Buy Signal is set off. When %B is above 50 and MACD lines above Zero, the issue is in an Uptrend.
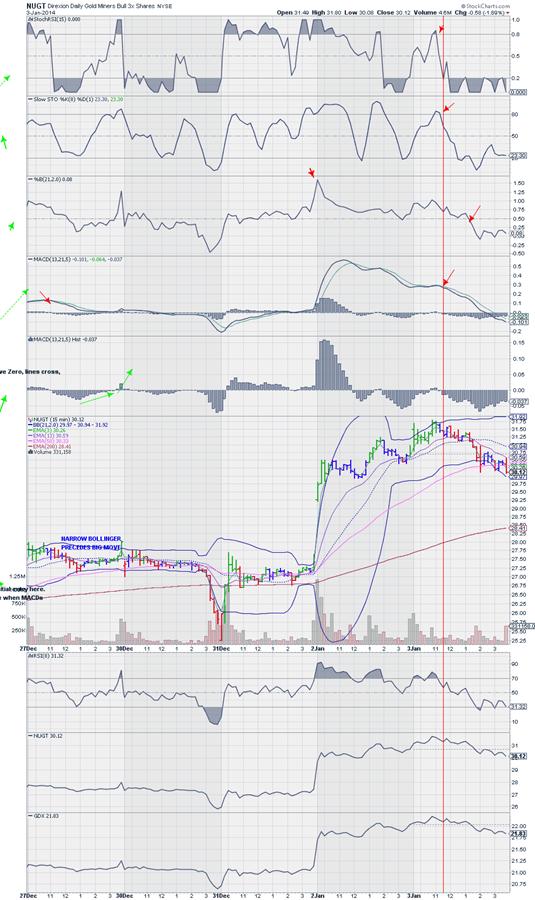
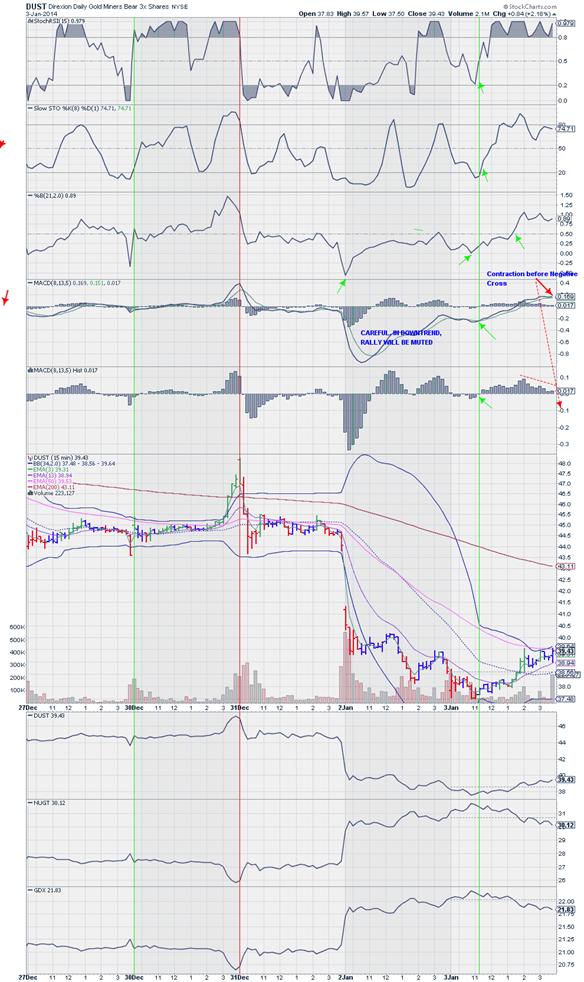
NUGT Gold Miners x 3 , 15min Chart Pg 17 .. Be In Cash.. Do not Buy until MACD lines cross up and approaching Zero Cross. You will see the Area between the 2 MACD lines begin to Contract or Diminishing.. wait for lines to Cross Up to Trigger an Initial Buy. When the Lower MACD Histogram crosses Zero, will indicate the positive MACD line cross Up. With Histogram on Upside is a good indication. When MACD cross Up again to Establish an Uptrend watch for Surge Up.. to optimize your Buy or Call Purchase.
DUST Bear Gold Miners x 3 . Ton confirm NUGT, its Antithesis, DUST is starting to give a Sell Signal. DUST is now in a Downtrend with %B below 50 and MACD below Zero, Up move will be muted until Uptrend well established. When MACD lines cross Zero, there will be a surge down in this case.
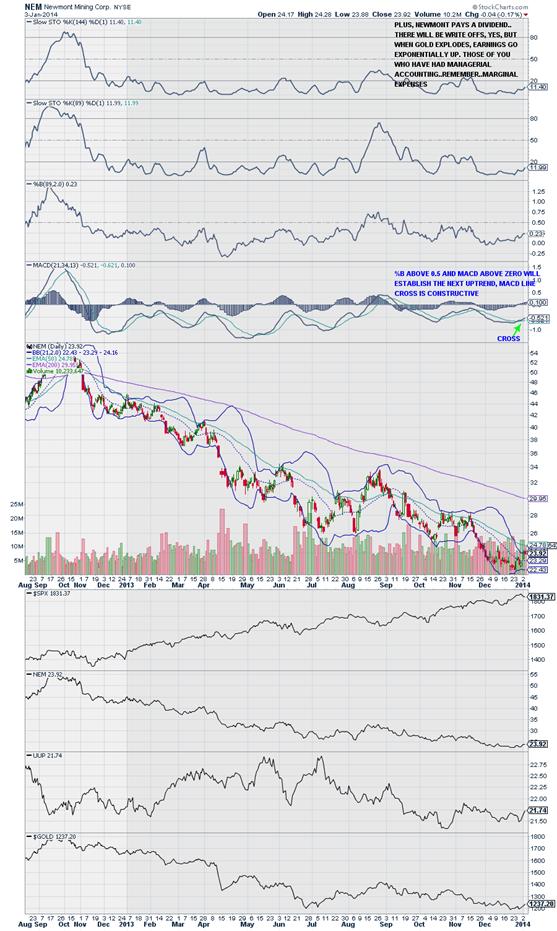
NEM Newmont Mines, a component of GDX, has been the Absolute Pig Dog of 2013. To confirm GDX, NEM has given a Buy Signal on the Daily Chart, using the same Triggers. Notice Green Price bar. This was the no 1 Worst Stock Perfomer for 2013. Could be one of the Best for 2014.
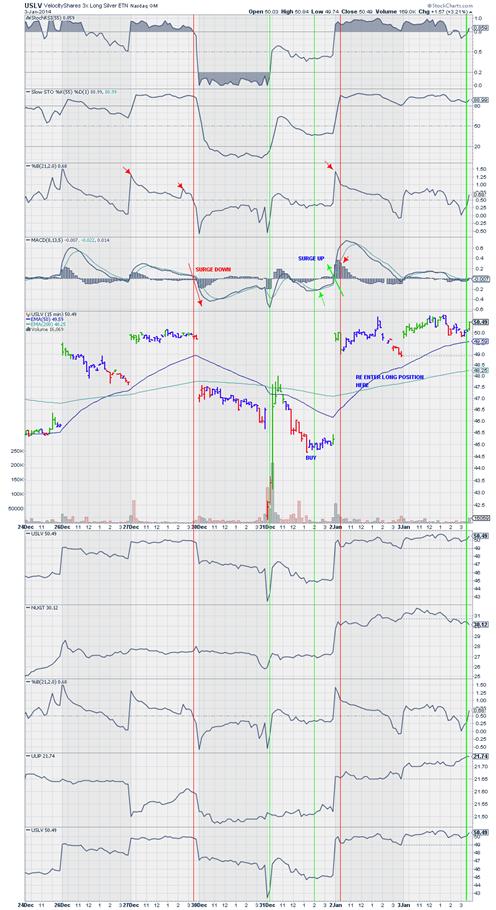
USLV Velocity Up Silver x 3. Of course, what Gold does, Silver tags along. Notice where MACD passes below or above Zero and the “SURGE” effect. Use this for timing your Entry, Exits and purchases of Puts or Calls on any issue.
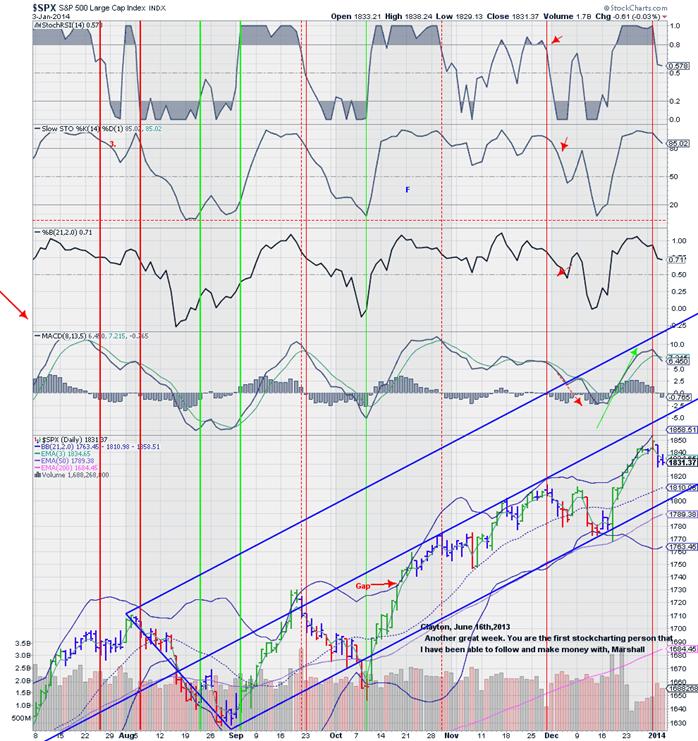
$SPX, The S&P 500, Daily .. Preliminary Sell Signal that the StockMarket may be topping or already Topped
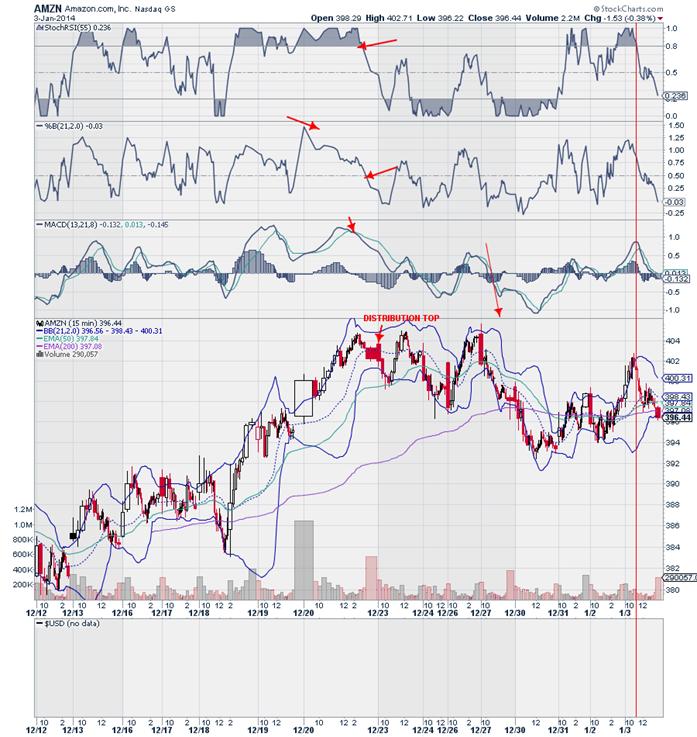
AMZN, Amazon 15min, A great company with Mr. Bezos, a man with great vision, but now overpriced
AAPL, Apple Computer, 15min, Notice the Candle Volume Bars Steve Jobs one of the Best if not the Best CEO who ever lived.

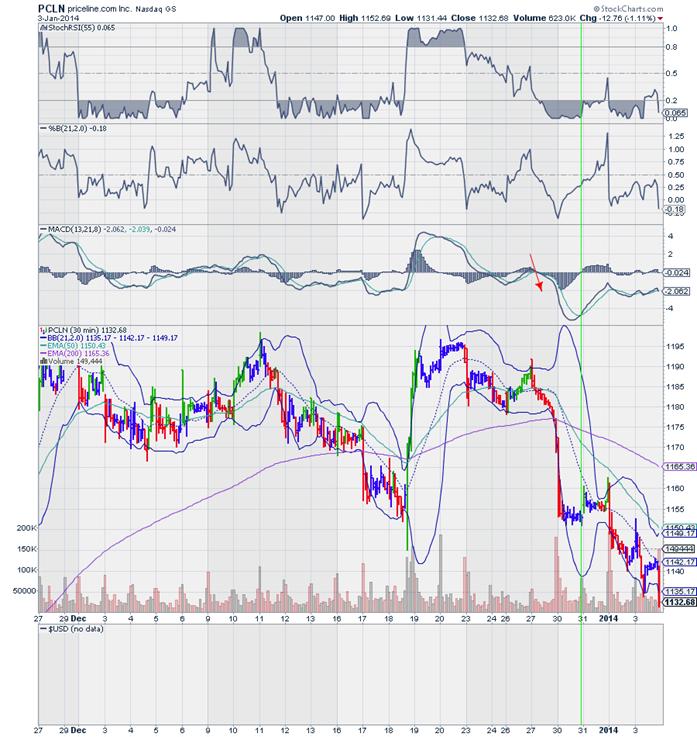
Priceline, PCLN, 30min example of one which gave a Sell Signal a bit earlier..Follow the Triggers as I have pointed out. Most importantly, see what happens when MACD lines Crossed below Zero, the Accelerated Surge Down. The Price can continue going down eventhough the MACD is heading Up until there is a Cross above Zero will PCLN price go Up. See Dec 19th as an example. MACD above ZeroUptrend, MACD below Zero DOWNTREND as we see now.
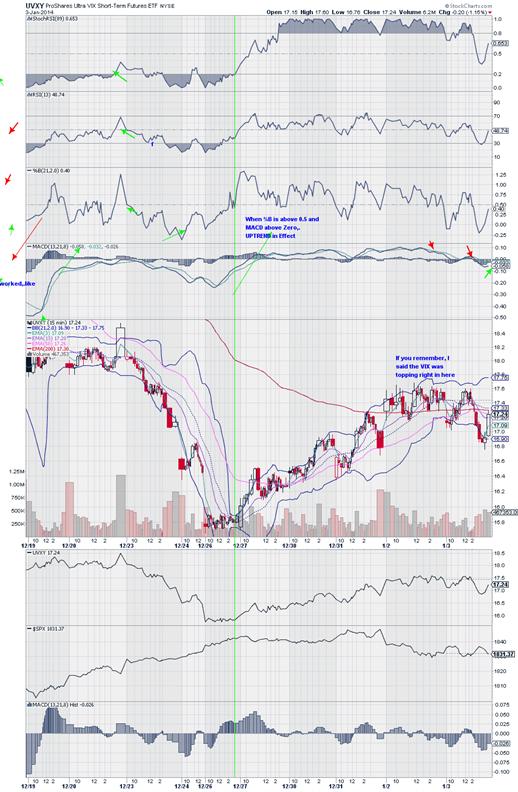
Next to NUGT & DUST, UVXY is an equal in Volatility, UVXY is $VIX x 3. There was a volume Buy at the close of Friday, in all indications UVXY will follow thourgh with the $SPX, DJIA, COMPQ declining. See what happens. This is a good example of what I mean with %B above Zero and MACD above Zero for Uptrend
For more examples of my work, please go to stockcharts.com, to the right PublicChartLists, see me at no 11 from the Top, Easy $$, Clayton Tom—Thank you for Viewing and your interest. Clayton Tom, stemsmexico@gmail.com Skype: stemsmexico3.
Using my system at stockcharts.com, Public Chart Lists, Easy $$, by Clayton Tom, you will see the rest of my work in reference to Gold, Silver, NUGT, DUST, USLV, DSLV, etc SPX, $VIX, VXX, UVXY, etc UPRO, SPXU, ERX, ERY, DIG, DUG, FAS, FAZ, TNA, TZA, DRN, DRV and Winners of 2013, which show a Sell and should be PUT or Shorted i.e. Pg 5, AAPL, GOOG, AMZN, PCLN, NFLX, FB, HLF (Hello, Mr Ackerman) etc. You may ask me to do an Opinion based strictly on the Indicators I use. stemsmexico@gmail.com. I am an ex-broker, Asst. V.P. in Commodities with Dean Witter back in the late 1960s and early 70s and went through the exact training course as depicted in the movie, “Seeking Happyness” with Will Smith. I am also a retired Pharmacist via Cal Berkeley, U.C. School of Pharmaceutical Science and the mandatory Courses in Math has enabled me to understand the Derivation of the Indicators used to make this almost a perfect Technical means of precisely spotting Tops and Bottoms as a function of the Price Fluctuations of Stocks, ETFs, Currencies, Commodities and Financials Bond Instruments. I also lack just one semester for my MBA in Marketing at Univ. of Cal . SF State University. Retired after 25 years in Retail Pharmacy, rated as the most Competive Independent Pharmacy Chain by the trade journal Pharmacy Times, 1995. Was the first Pharmacy in the U.S. to promote Generic Drugs in the early 1970s.
© 2013 Copyright Thomas Clayton - All Rights Reserved
Disclaimer: The above is a matter of opinion provided for general information purposes only and is not intended as investment advice. Information and analysis above are derived from sources and utilising methods believed to be reliable, but we cannot accept responsibility for any losses you may incur as a result of this analysis. Individuals should consult with their personal financial advisors.
© 2005-2022 http://www.MarketOracle.co.uk - The Market Oracle is a FREE Daily Financial Markets Analysis & Forecasting online publication.