


Did We See Stock Market Cycle Top Last Week?
Stock-Markets / Stock Markets 2014 Jan 20, 2014 - 03:30 PM GMT

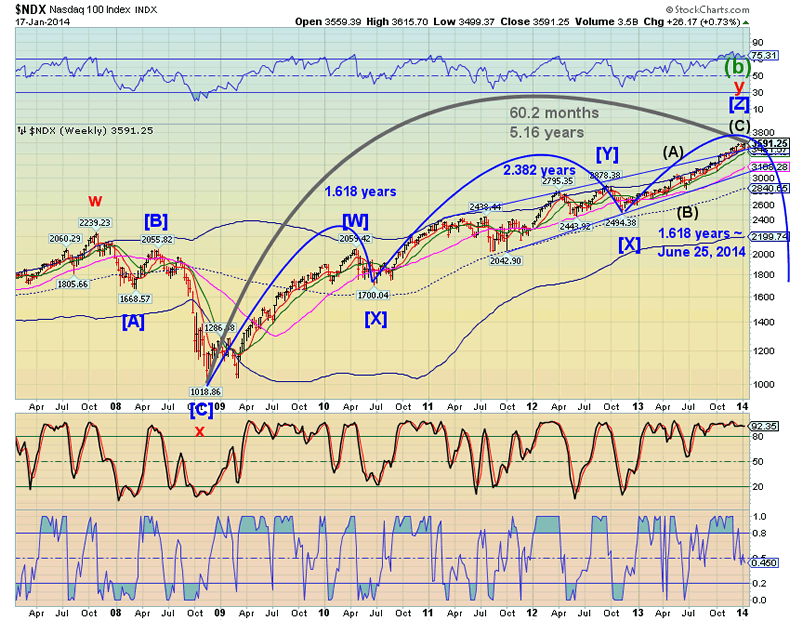
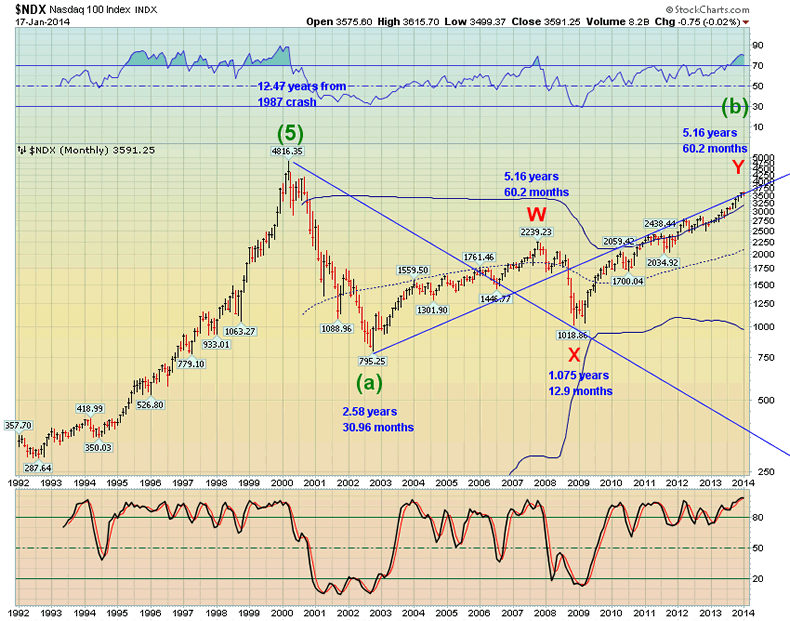
 I have been reviewing my long-term charts and have been updating them. I was surprised when I discovered that today (January 18) is exactly 5.16 years from the November 21, 2008 low in the NDX. I have often been referring to the NDX Cycles, since they seem to be much more accurate than the Dow/SPX Cycles. The deviations from the measurements above are often within 3 days and no longer than 8 days, so this is a wonderful monitoring chart. I am constantly amazed at the relationships between the Cycles and the Waves.
Now let’s apply these Cycles to the SPX.
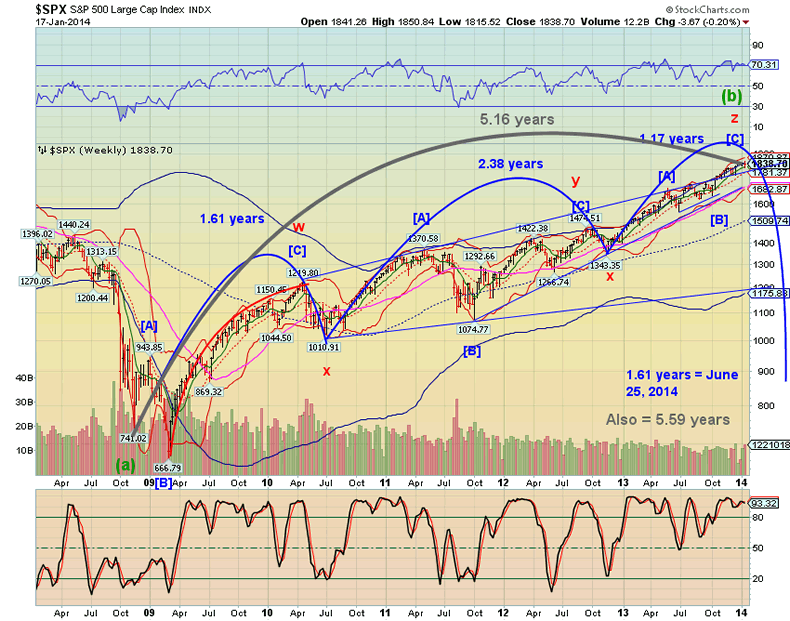
Here are the same Cycles with the actual measurements. The keys to the lack of clarity in the SPX cycles are:
1. The Decline from January 5, 2009 to March 9, 2009 appears clearly corrective, especially so on a weekly chart.
2. Many Elliotticians, including the best of them, viewed this decline as an impulse. This also leads to calling the entire decline from October 11, 2007 to March 9, 2009 an impulse. As a result, they dismiss the Orthodox Broadening Top of Grand Super Cycle degree, which implies to many (lesser-trained) Elliotticians that the bear market may have already been over in 2009. I believe that neither conclusion is correct.
3. Many higher-degree Cycles ignore Wave [B], especially on the larger-degree Cycles. Instead, they measure the entire Elliott Wave, whether it be impulsive (1-2-3-4-5) or corrective (A-B-C). You can see that clearly in the blue Cycles shown in the chart. That is why many Cycle calculations can be subject to error, especially in a corrective bear market such as this. We naturally gravitate toward the lowest point of the year to start our Cycle measurements. That may be why our Cycle measurements from March 9, 2009 have been faulty. With few exceptions, the time span involved in a Cycle divided by 4.3 must not be a complex number in order to be valid.
Conclusion:
1. The time span from November 21, 2008 (orthodox market low) to the present is 5.16 (4.3 * 12) years.
2. The time span from the October 30, 2007 high (NDX) to the November 21, 2008 low is 1.075 years (12.9 months).
3. The next projected major Cycle turn date is October 1, 2015. That is almost (within 4 days) 1.72 years from last week’s peak on January 15. This suggests that the Cycle turn may already be underway.
4. This may set off one of the most devastating deflationary declines in stock market history, since it may be a Fibonacci 1.618 times greater than the 2008 decline in time. It may also be that number in magnitude as well as time. Using the same measurements, that may give a potential target for the SPX of 381.00. I am not the only one calling for that target.
The next near-term Cycle turn date is February 24. At that time, the US Dollar and the VIX may see new highs, while US. Equities, China Equities, EuroStoxx, Crude Oil and Gold may see new lows by then. Given the massive Broadening Tops in most of the stock indexes, it should be no surprise to see a 25-30% decline, as well. This decline may take 26 to 30 market days, which may be twice the 13 market days it took for the flash crash ending August 9, 2011, which wiped out nearly 20% of the market equity.
As you may surmise from my Cycle calculations, however, Cycle Wave I of Super Cycle Wave (c) may not be over until the end of June. That would be .43 years from this week.
Regards,
Tony
Our Investment Advisor Registration is on the Web
We are in the process of updating our website at www.thepracticalinvestor.com to have more information on our services. Log on and click on Advisor Registration to get more details.
If you are a client or wish to become one, please make an appointment to discuss our investment strategies by calling Connie or Tony at (517) 699-1554, ext 10 or 11. Or e-mail us at tpi@thepracticalinvestor.com .
Anthony M. Cherniawski, President and CIO http://www.thepracticalinvestor.com
As a State Registered Investment Advisor, The Practical Investor (TPI) manages private client investment portfolios using a proprietary investment strategy created by Chief Investment Officer Tony Cherniawski. Throughout 2000-01, when many investors felt the pain of double digit market losses, TPI successfully navigated the choppy investment waters, creating a profit for our private investment clients. With a focus on preserving assets and capitalizing on opportunities, TPI clients benefited greatly from the TPI strategies, allowing them to stay on track with their life goals
Disclaimer: The content in this article is written for educational and informational purposes only. There is no offer or recommendation to buy or sell any security and no information contained here should be interpreted or construed as investment advice. Do you own due diligence as the information in this article is the opinion of Anthony M. Cherniawski and subject to change without notice.
Anthony M. Cherniawski Archive |
© 2005-2022 http://www.MarketOracle.co.uk - The Market Oracle is a FREE Daily Financial Markets Analysis & Forecasting online publication.