


Stock Market Elliott Wave Primary III Still Underway
Stock-Markets / Stock Markets 2014 May 04, 2014 - 10:58 AM GMTBy: Tony_Caldaro

 The market made some progress this week. Thanks to the two gap up openings early in the week, and no surprises from the FED or Q1 GDP. For the week the SPX/DOW were +0.95%, the NDX/NAZ were +1.35%, and the DJ World index was +1.10%. Economic reports for the week remained positive. On the uptick: pending homes sales, ADP, Chicago PMI, personal income/spending, PCE, ISM manufacturing, construction spending, auto sales, Payrolls, factory orders, and the WLEI. On the downtick: Case-Shiller, Q1 GDP, the monetary base, and weekly jobless claims rose. Next week we get reports on ISM services and Consumer credit, plus Congressional testimony from FED chair Yellen on Wednesday.
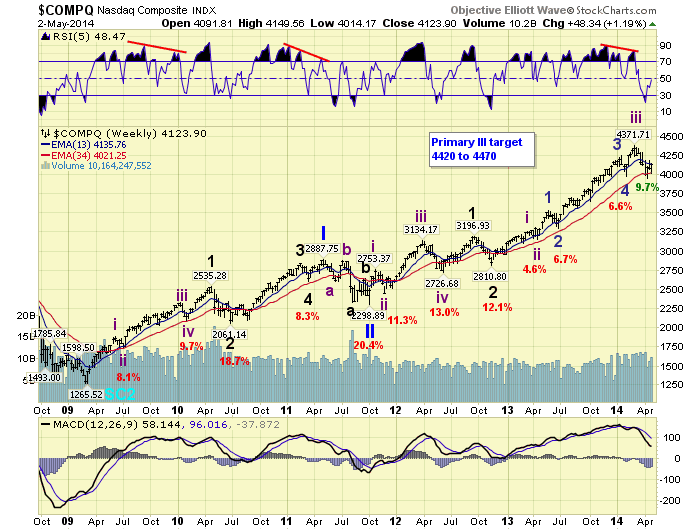
NASDAQ
There are lots of counts being kicked around on the SPX/DOW. The NDX/NAZ, however, continues to display no signs of shifting from its count. While it has been pressuring the general market, it still has two more uptrends before ending Primary III. After reviewing the wave characteristics of its entire bull market we arrived at the following:
Major 3 high July 4420
Major 4 low August
Major 5 high Sept 4470
This fits with the SPX/DOW i-ii-iii-iv-v count for Major 5, and with the QE 3 ending target around SPX 2070. One last thing. The last time the NAZ dropped 400 points during a correction was the spring of 2012. Its next uptrend was quite choppy in the beginning, as you can see, until it finally kicked in. Quite similar to what it is doing now.
SEASONALS
In the early part of this bull market it experienced a spring swoon. Then when everyone noticed it, it began to lessen.
2009 June high-July low-then uptrend until January.
2010 April high-July low-then uptrend until February.
2011 May high-then no low until October.
2012 April high-June low-then uptrend until September.
2013 May high-June low- then uptrend until August.
2014 April high-April low ?- then uptrend until …
Notice how the selloffs started in the spring, kept increasing in duration until 2011. Then started lessening in duration and impact into 2014.
LONG TERM: bull market
This Cycle wave [1] bull market continues to unfold from the Super Cycle wave 2 low in March 2009. Rising Cycle wave bull markets unfold in five Primary waves. Primary waves I and II completed in 2011, and Primary wave III had been underway since then. When Primary III concludes, possibly by this summer, a steep Primary IV correction will follow. Then Primary wave V should take the market to new highs.
Each rising Primary wave unfolds in five Major waves, as you can observe during Primary wave I. Primary wave III was a bit tricky as it unfolded. As Major wave 3 apparently just kept extending. Nevertheless we have labeled the February 2014 low as the end of Major wave 4, and we are currently in a subdividing Major wave 5. This suggests, both the SPX and DOW, have two more uptrends before a Major wave 5 top, and the end of Primary III. This count fits with the count being carried in the NDX/NAZ. So it does appear we are in sync with the four major indices.
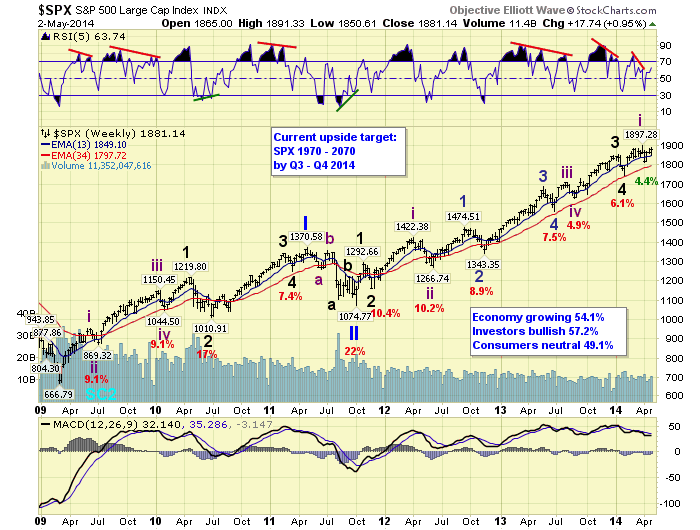
MEDIUM TERM: SPX uptrend probable, DOW in uptrend
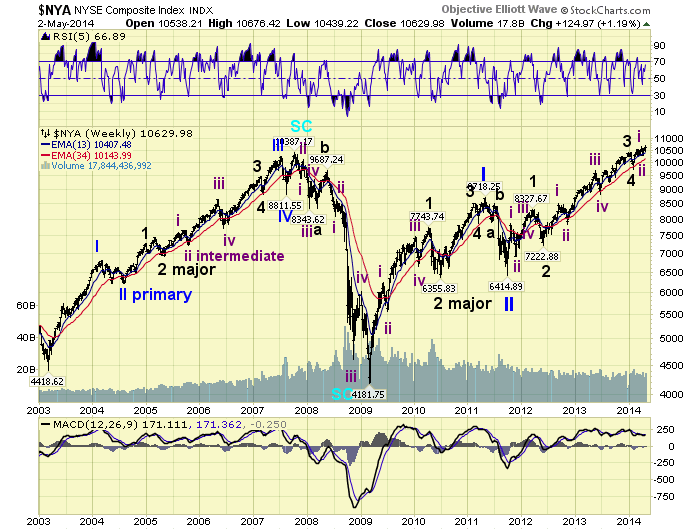
As noted above we are expecting five waves (trends) from the Major wave 4 low in February before Major wave 5 concludes. The first uptrend rallied from SPX 1738 to 1897 in early April. Then we had a correction down to SPX 1814 by mid-April. Now we are only points away from confirming the third wave from that low. The DOW, and the NYSE for that matter, has already confirmed an uptrend. The NYSE is also on the same count.
The recent correction in the DOW (16,662 to 16,015) was only 3.7%. Its smallest correction of the entire bull market. Should the SPX also confirm an uptrend it too would have had it smallest correction of the bull market as well at 4.4%. This is not a sign of general weakness, but of strength. Keep in mind, while these small corrections were unfolding in the SPX/DOW, the NDX/NAZ were correcting 8.7% and 9.7% respectively. Also, if we count the internal structure of the DOW during its February to April uptrend we observe an orthodox high in early March, then an irregular flat into the mid-April low. Irregular flats may look like head and shoulders tops, but are actually quite bullish.
With the NDX/NAZ still about 6% to 7% below their all time highs, and our projected initial target. The SPX should at least reach the lower end of the Primary III projected target at 1970 to 2070. After that concludes a Major wave 5 diagonal triangle can still form, in the both the SPX and DOW. But not like the one being currently carried on the DOW charts. It would be shifted one degree further out. For now, let’s just track this uptrend and see what unfolds. Medium term support at the 1869 and 1841 pivots, with resistance at the 1901 and 1929 pivots.
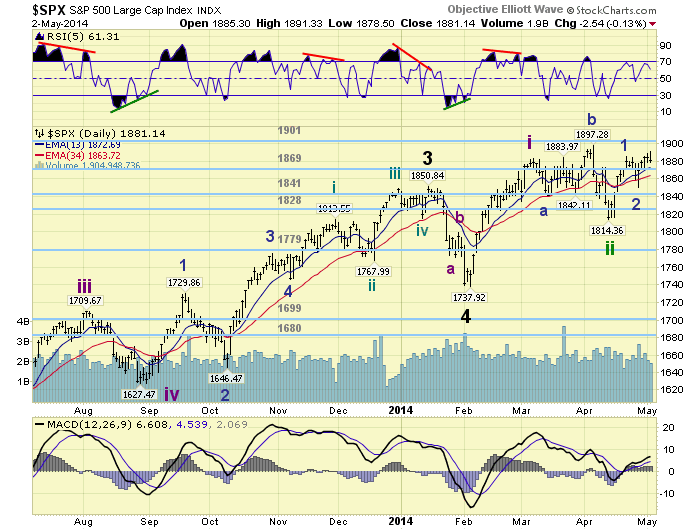
SHORT TERM
Short term support is at the 1869 and 1841 pivots, with resistance at the 1901 and 1929 pivots. Short term momentum ended the week heading lower after a negative divergence. The short term OEW charts remain positive with the reversal level now SPX 1879.
From the recent potential downtrend low at SPX 1814 we counted five waves up to 1885, and labeled that Minor wave 1. Then after a complex double three pullback to SPX 1851, which we labeled Minor 2, the market has rallied to a higher high at SPX 1891. This recent rally also looks like five waves up, but of a smaller degree (Minute wave). We counted the advance from SPX 1851: 1880-1871-1889-1880-1891.
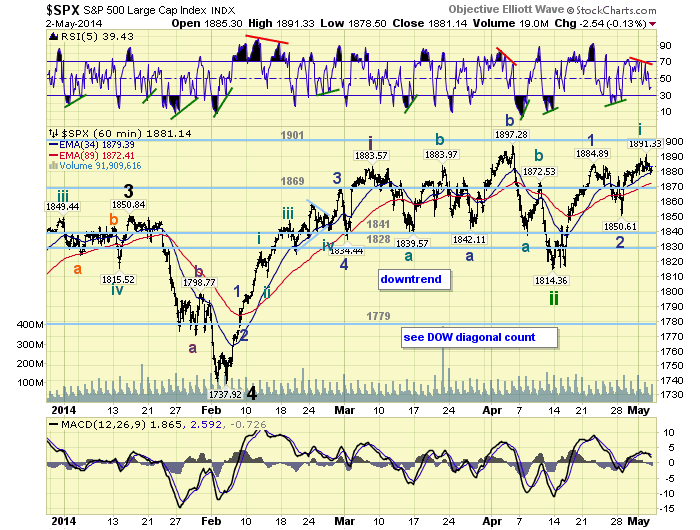
After that high, around 10:30 Friday, the market pulled back to SPX 1879. Notice it found support around the 4th wave (1880). Also note, the shortest wave during this last rally was the fifth wave. When this occurs sometimes the market pulls back to the previous second wave (1871). So a continued pullback to the OEW 1869 pivot would not be anything unusual. For now, we are labeling the SPX 1891 high as Minute wave one of Minor 3, and will wait to see where Minute wave two bottoms. Until SPX 1891 is exceeded we can not be certain that Minute two has ended. Best to your trading!
FOREIGN MARKETS
The Asian markets were mostly lower on the week for a new loss of 0.60%.
The European markets were mostly higher for a net gain of 1.30%.
The Commodity equity group were mostly higher for a net gain of 1.70%.
The DJ World index remains in an uptrend and gained 1.10% on the week.
COMMODITIES
Bonds have confirmed an uptrend gaining 0.5% on the week.
Crude remains in a downtrend losing 0.9% on the week.
Gold is trying to establish an uptrend but lost 0.1% on the week.
The USD remains in a downtrend losing 0.3% on the week.
NEXT WEEK
Monday: ISM services at 10am. Tuesday: the Trade deficit. Wednesday: Consumer credit. Thursday: weekly Jobless claims. Friday: Wholesale inventories. The FED has a busy week. Tuesday: a speech from FED governor Stein in the evening. Wednesday: Congressional testimony from FED chair Yellen. Thursday: a speech from FED governor Tarullo. Best to your weekend and week!
CHARTS: http://stockcharts.com/public/1269446/tenpp
http://caldaroew.spaces.live.com
After about 40 years of investing in the markets one learns that the markets are constantly changing, not only in price, but in what drives the markets. In the 1960s, the Nifty Fifty were the leaders of the stock market. In the 1970s, stock selection using Technical Analysis was important, as the market stayed with a trading range for the entire decade. In the 1980s, the market finally broke out of it doldrums, as the DOW broke through 1100 in 1982, and launched the greatest bull market on record.
Sharing is an important aspect of a life. Over 100 people have joined our group, from all walks of life, covering twenty three countries across the globe. It's been the most fun I have ever had in the market. Sharing uncommon knowledge, with investors. In hope of aiding them in finding their financial independence.
Copyright © 2014 Tony Caldaro - All Rights Reserved Disclaimer: The above is a matter of opinion provided for general information purposes only and is not intended as investment advice. Information and analysis above are derived from sources and utilising methods believed to be reliable, but we cannot accept responsibility for any losses you may incur as a result of this analysis. Individuals should consult with their personal financial advisors.
Tony Caldaro Archive |
© 2005-2022 http://www.MarketOracle.co.uk - The Market Oracle is a FREE Daily Financial Markets Analysis & Forecasting online publication.