


Nasdaq Tech Stock Index Next Surge Higher? Elliott Wave Analysis
Stock-Markets / Stock Markets 2014 May 17, 2014 - 08:10 PM GMTBy: Tony_Caldaro

 Another week in which a new all time high was sold off. For the week the SPX/DOW were -0.3%, the NDX/NAZ were +0.7%, and the DJ World index was +0.2%. Economic reports came in about 2 to 1 to the positive. On the uptick: retail sales, business inventories, the PPI/CPI, the NY FED, housing starts, building permits, the WLEI, the monetary base, plus, weekly jobless claims improved and the treasury ran a surplus. On the downtick: export/import prices, industrial production, the Philly FED, the NAHB index, and consumer sentiment. Next week few economic reports, but we do have the FOMC minutes plus existing/new home sales. Best to your week!
LONG TERM: bull market
This Cycle wave [1] bull market continues to unfold as the general averages made all time new highs this week. We continue to expect this Cycle wave to unfold with five Primary waves from the March 2009 SPX 667 low. Primary waves I and II completed in 2011, and Primary wave III has been underway since then. Primary I divided into five Major waves with a subdividing Major wave 1. Primary III had a simple Major 1, but both Major waves 3 and 5 are subdividing. Major waves 1 and 2 completed in late 2011, and Major wave 3 and 4 completed in early 2014. Major wave 5 has been underway since that February 2014 low.
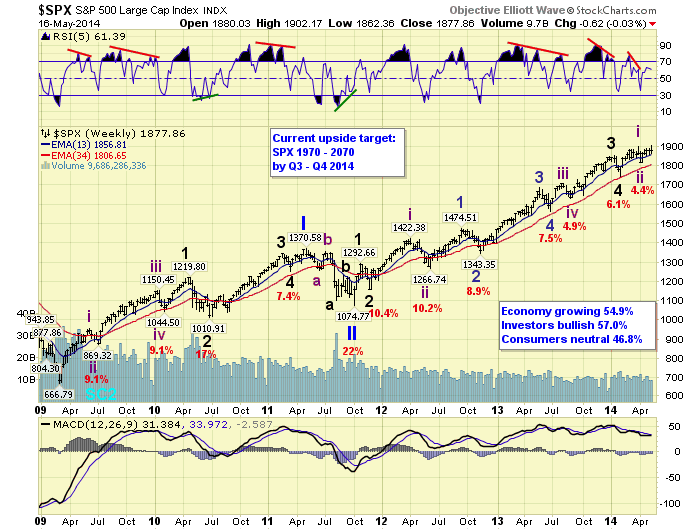
When Major wave 5 does conclude it should end Primary III as well. Then the market should experience its worse correction since 2011 for Primary IV. After that Primary wave V should take the market to all time new highs to end the bull market. Currently we have an upside target of SPX 1970-2070 by Q3/Q4 2014.
NASDAQ
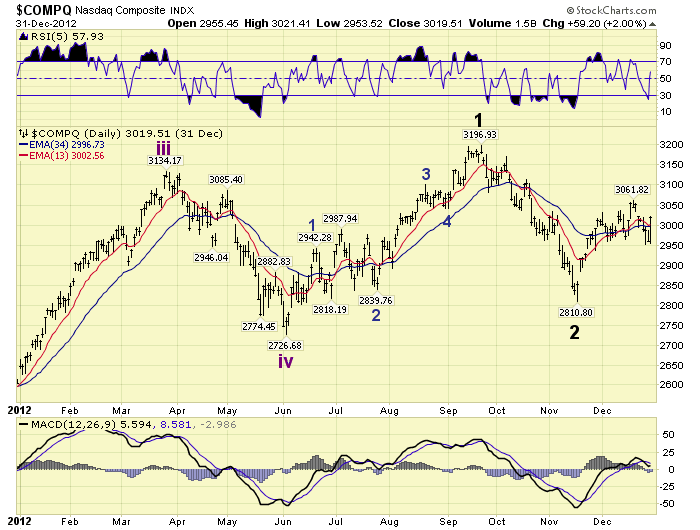
The general market has had a difficult time since early March in sustaining upside rallies. Every rally to new all time highs has been met with selling. The problem, as we see it, has been the 9.7% selloff in the Nasdaq (NAZ), and the choppy activity since its mid-April low. We have noted previously the 13.0% spring correction of 2012, and early stages of its next uptrend look quite similar to what we have been experiencing lately. Notice that correction was also one of an Intermediate wave iv degree.
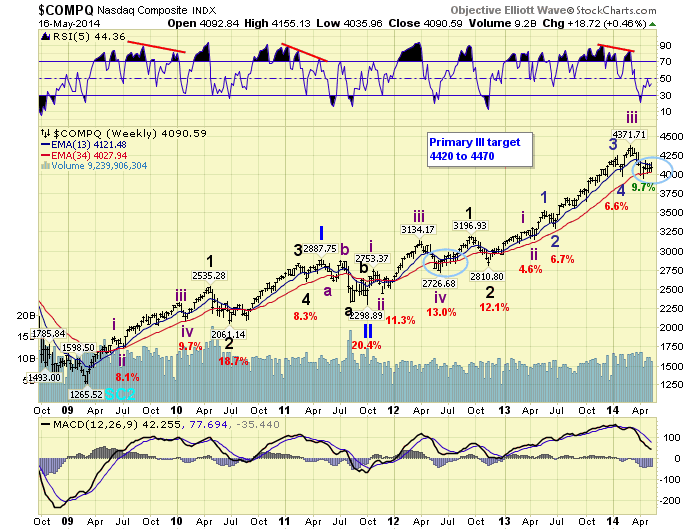
After that correction in 2012 the NAZ moved higher but was quite choppy. Eventually after several weeks it completed a Minor wave 2, and the uptrend kicked in to the upside.
NAZ daily 2012
Now observe the recent action in the NAZ since its mid-April low. Another chop-chop affair.
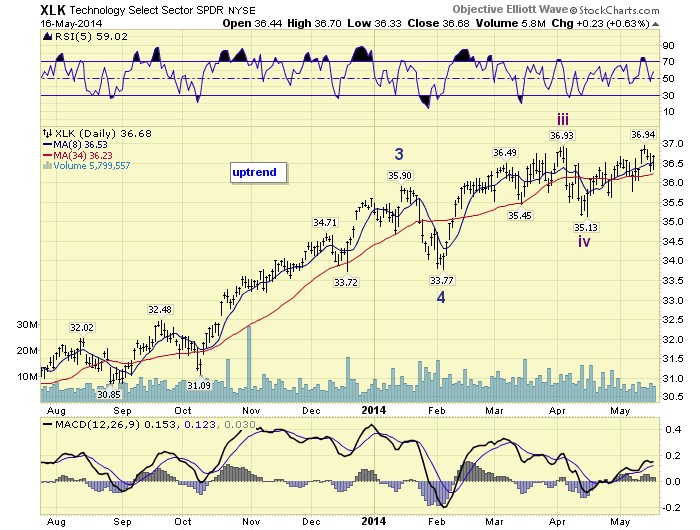
It is quite easy to extract a wave pattern seemingly out of thin air and make a comparison. This alone would not imply any conviction to a particular count. Unless there is additional, more compelling, proof. Unbeknown to most the SPX sector XLK has tracked the NAZ, wave for wave, since the bull market began. When one compares the weekly chart of both they will observe a direct relationship, wave for wave, with the exact same counts. Notice, it too had a choppy period after the 2012 Intermediate wave iv correction.
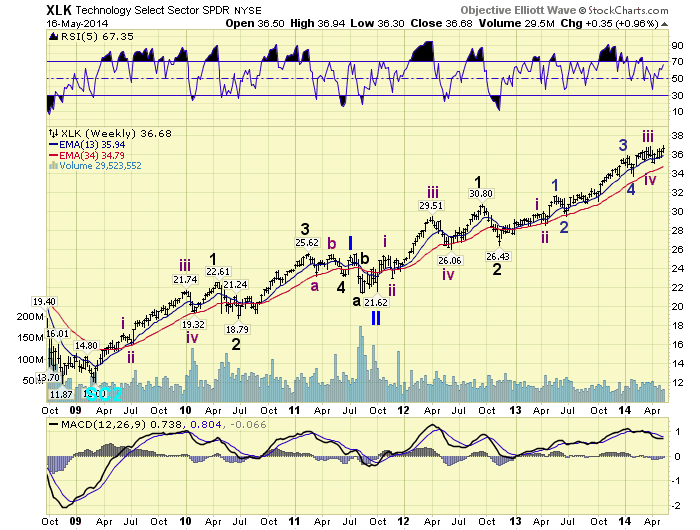
When comparing the two weekly charts one will observe its recent correction was not as severe as the 9.7% correction in the NAZ. One will also observe that we have already marked a completed Intermediate wave iv at the mid-April low. On the daily chart we label it as being in an uptrend, which it recently confirmed. Since the XLK has tracked the NDX/NAZ, wave for wave, throughout the entire bull market. We see no reason for this not to continue. Simply put, the XLK is suggesting the NDX/NAZ uptrend will soon kick in to the upside. It is just a matter of time.
MEDIUM TERM: uptrend
The uptrend in the SPX started in mid-April at SPX 1814. It too has been quite choppy, especially during May. We labeled the first rally to SPX 1884 as Minor wave 1, and the pullback to 1851 as Minor wave 2. Then we labeled the rally to SPX 1891 as Minute wave one and the pullback to 1860 as Minute wave two. However, the rally off that SPX 1860 low turned into a corrective three wave affair on Wednesday. When the SPX dropped below 1889, overlapping the first rally. Thursday confirmed this scenario with a rapid selloff to SPX 1862, before rallying into the close Friday.
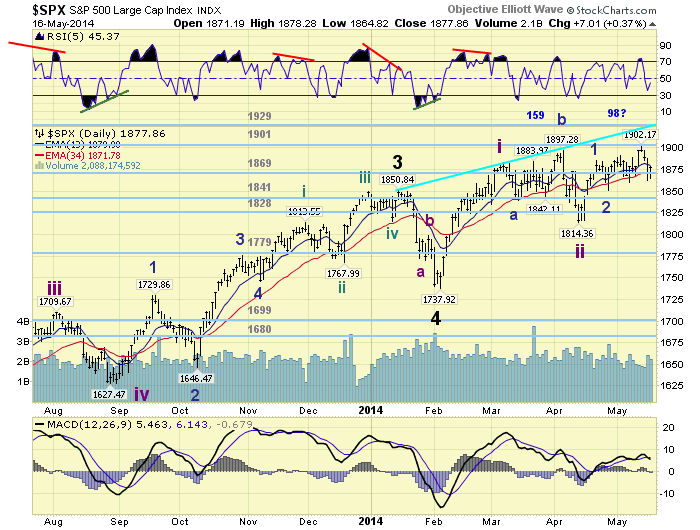
Ideally, but not required, the SPX should retest the 1860 low to complete an irregular flat. This would end Minute wave two, and then the market should start its third of third rally. A drop below SPX 1860 would be fine. But a drop below the Minor wave 2 low at SPX 1851 would suggest this entire uptrend was corrective. Then a retest of SPX 1814, or lower, should follow. Until those events occur we continue to expect this uptrend to continue. We noted on the daily chart a rising trend line that the SPX needs to clear for this uptrend to move substantially higher. Until that occurs we feel the upside potential remains limited. Medium term support remains at the 1869 and 1841 pivots, with resistance at the 1901 and 1929 pivots.
SHORT TERM
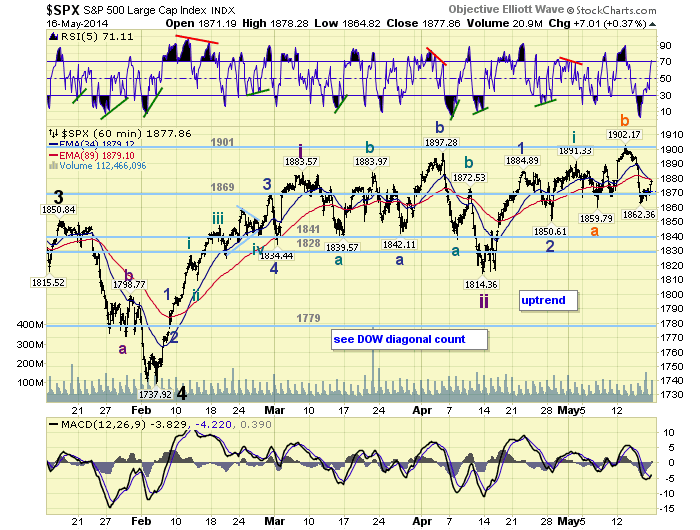
Short term support is at the 1869 pivot and SPX 1860, with resistance at the 1901 and 1929 pivots. Short term momentum ended the week slightly overbought. The short term OEW charts are positive with the reversal level at SPX 1873.
As you can observe from the above chart the price activity in the SPX has remained in a narrow range since March. For the most part between the OEW 1841 and 1901 pivots. During a bull market these consolidations are usually bullish. But after a five year bull market they can also be considered to be a topping formation. This kind of action has kept many pundits guessing the next major move in this market. When one compares the SPX daily chart with the NAZ daily chart, both above, it is quite clear why the SPX has been in a trading range. The NAZ has been heading lower for most of that period. An upside surge in that index, which is expected eventually, will certainly usher in an upside breakout in the SPX. Best to your trading!
FOREIGN MARKETS
The Asian markets were mostly higher on the week for a net gain of 1.5%.
The European markets were mostly lower for as net loss of 1.2%.
The Commodity equity group were mostly higher gaining 1.3%.
The DJ World index continues to uptrend and gained 0.2%.
COMMODITIES
Bonds continue their uptrend gaining 0.5% on the week.
Crude is still in a downtrend but gained 2.1% on the week.
Gold continues to act choppy, getting no support from Silver, and it appears its downtrend is continuing. Yet it gained 0.3% on the week.
The USD looks like it is uptrending and gained 0.2% on the week.
NEXT WEEK
Wednesday: the FOMC minutes at 2pm. Thursday: weekly Jobless claims, Existing home sales and Leading indicators. Friday: New home sales. Also on Wednesday FED chairman Yellen gives a speech at 11:30. Looks like a technical week ahead for the markets. Best to your weekend and week!
CHARTS: http://stockcharts.com/public/1269446/tenpp
http://caldaroew.spaces.live.com
After about 40 years of investing in the markets one learns that the markets are constantly changing, not only in price, but in what drives the markets. In the 1960s, the Nifty Fifty were the leaders of the stock market. In the 1970s, stock selection using Technical Analysis was important, as the market stayed with a trading range for the entire decade. In the 1980s, the market finally broke out of it doldrums, as the DOW broke through 1100 in 1982, and launched the greatest bull market on record.
Sharing is an important aspect of a life. Over 100 people have joined our group, from all walks of life, covering twenty three countries across the globe. It's been the most fun I have ever had in the market. Sharing uncommon knowledge, with investors. In hope of aiding them in finding their financial independence.
Copyright © 2014 Tony Caldaro - All Rights Reserved Disclaimer: The above is a matter of opinion provided for general information purposes only and is not intended as investment advice. Information and analysis above are derived from sources and utilising methods believed to be reliable, but we cannot accept responsibility for any losses you may incur as a result of this analysis. Individuals should consult with their personal financial advisors.
Tony Caldaro Archive |
© 2005-2022 http://www.MarketOracle.co.uk - The Market Oracle is a FREE Daily Financial Markets Analysis & Forecasting online publication.