


Stock Market New All Time Highs
Stock-Markets / Stock Markets 2014 May 31, 2014 - 04:20 PM GMTBy: Tony_Caldaro

 For a four day trading week the market did fairly well. It opened at new all time highs on Tuesday. Then made higher highs, with small pullbacks along the way, every day this week. For the week the SPX/DOW were +0.95%, the NDX/NAZ were +1.50%, and the DJ World gained 0.75%. On the economic front reports continue to come in higher. On the uptick: durable goods, FHFA housing, consumer confidence/sentiment, pending home sales, personal income, the PCE, Chicago PMI, the WLEI, the monetary base, and weekly jobless claims improved. On the downtick: personal spending, Case-Shiller and Q1 GDP. Next week we get the ISM indices, monthly Payrolls and the FED’s Beige book.
LONG TERM: bull market
We are now 62 months from the March 2009 bear market low, and this market is still making new all time highs. During this period the SPX has gained 188%. Quite impressive. Despite this tremendous gain we do not see the bull market nearing an end just yet. There are still several trends that need to unfold, and a possibly very steep correction soon.
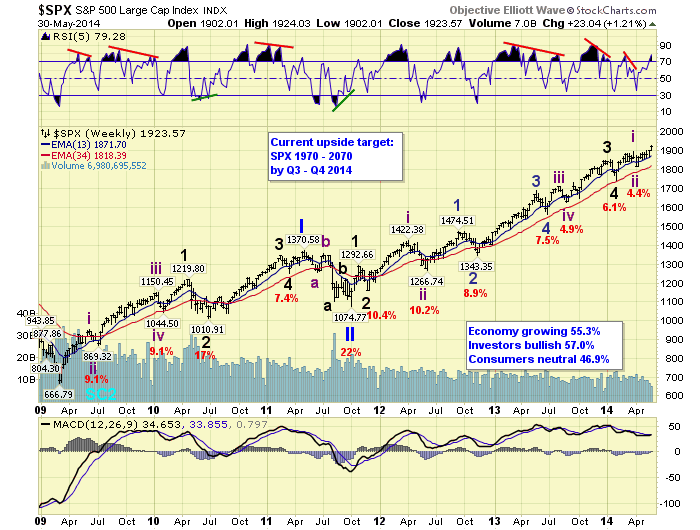
We continue to count this bull market as Cycle wave [1], consisting of five Primary waves. Primary waves I and II completed in 2011, and Primary wave III has been underway since then. Primary I divided into five Major waves with a subdividing Major 1. Primary III is also dividing into five Major waves, but now Major waves 3 and 5 are subdividing. Major waves 1 and 2 completed in late 2011, and Major waves 3 and 4 completed in early 2014. Major wave 5 has been underway since February.
When Major 5 concludes it should end Primary wave III. Then a potentially steep, multi-month, correction will follow for Primary IV. Typically, during bull markets, Primary waves II and IV are similar in depth and duration. Primary II took five months to unfold, and the market lost 22% during the decline. We are expecting Primary IV to last about three months with a market loss of 15+%. Then Primary V should take the market to new highs to conclude the bull market. Thus far we are maintaining our bull market target range of SPX 1970 to 2070 by Q3/Q4.
MEDIUM TERM: uptrend
For the past several weeks we have been providing technical evidence why the steep correction in the NDX/NAZ, the choppiness in the SPX/DOW, and seasonality factors would not stop the market from making all time new highs soon. Obviously our work has paid off. Our work in the NDX/NAZ was clearly the key to this conclusion.
Now that both indices are in confirmed uptrends, we still expect the NAZ to make new bull market highs before its uptrend ends. The NDX already accomplished that goal this week. Currently, the NAZ is still 2.8% below its previous high. This suggests, even if the NAZ outpaces the SPX 2 to 1, in percentage terms, the SPX should hit the OEW 1956 pivot.
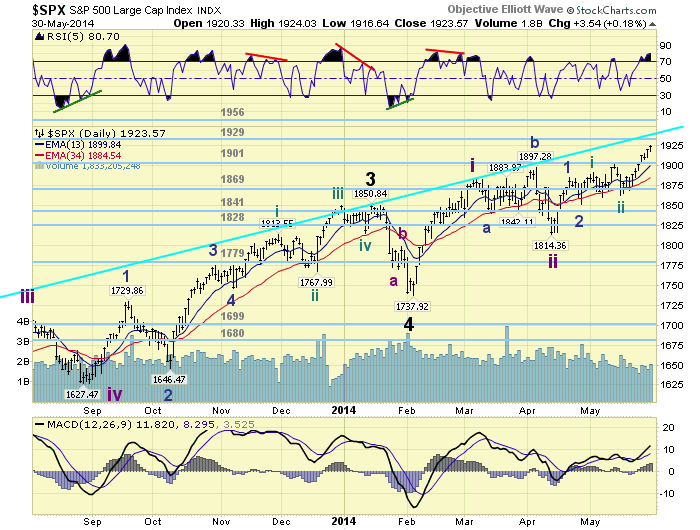
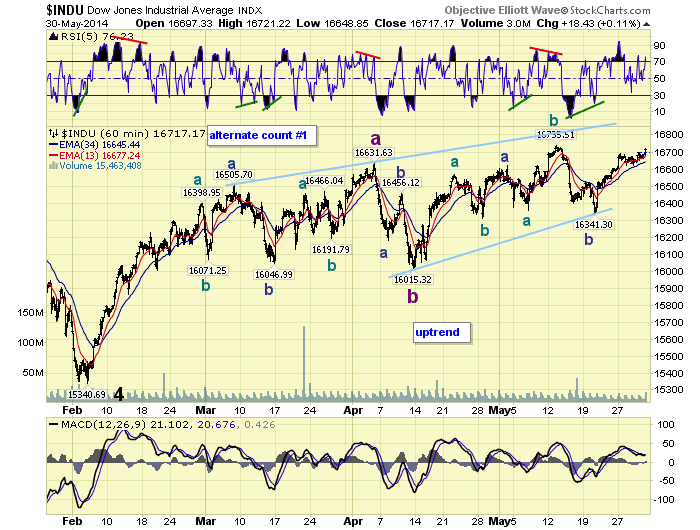
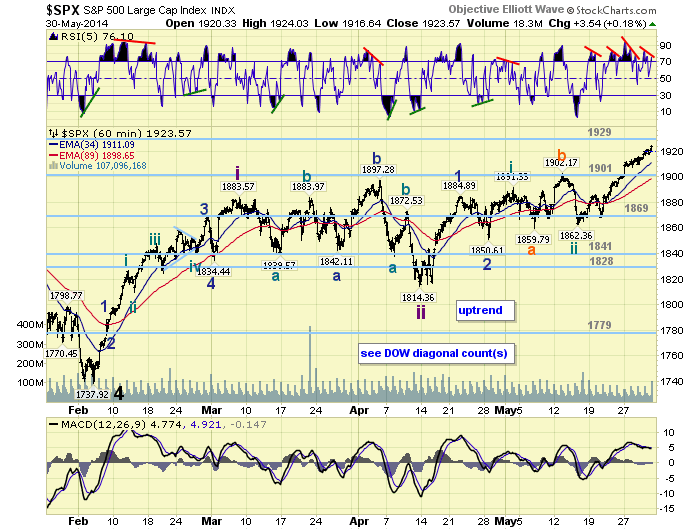
After reviewing the internal counts within all four major indices uptrends. We found the SPX/NDX/NAZ appear to be all similar. All three appear to be in Minute iii of Minor 3 of their respective uptrends. The DOW, however, looks to be quite different. It continues to act like it is in some sort of diagonal triangle pattern from its Major wave 4 low in February. While this is not a problem for the general market. It does help to confirm that the other three indices are in a Major wave 5 topping pattern. Medium term support is at the 1901 and 1869 pivots, with resistance at the 1929 and 1956 pivots.
SHORT TERM
Short term support is at the 1901 pivot and SPX 1891, with resistance at the 1929 and 1956 pivots. Short term momentum ended the week with a negative divergence. The short term OEW charts remains positive from SPX 1877, with the reversal level now 1918.
Minor 1 rose from SPX 1814-1885 (71 pts.). With Minor 3 reaching SPX 1924 on Friday, it is currently only a couple of points longer than Minor 1: SPX 1851-1924 (73 pts.). If this one to one relationship is to remain. Then the OEW 1929 pivot should offer some serious resistance for much of next week. This would allow time for the smaller waves, yet to unfold, to complete. Adding to this possibility is the series of negative divergences on the hourly chart, and the fact that the market has not had one notable pullback in seven trading days. Next week could be quite choppy. Best to your trading!
FOREIGN MARKETS
The Asian markets were mixed on the week for a net loss of 0.2%.
The European markets were mostly higher for a net gain of 1.8%.
The Commodity equity group were all lower losing 1.8%.
The DJ World index continues to uptrend and gained 0.8%.
COMMODITIES
Bonds continue to uptrend and gained 0.4% on the week.
Crude remains choppy losing 1.5% on the week.
Gold broke down through $1260 support, remains in a downtrend, and lost 3.3% on the week.
The USD appears to be in an uptrend but ended flat on the week. Both the EUR and CHF are quite oversold and due for at least a bounce.
NEXT WEEK
Monday: ISM manufacturing and Construction spending at 10am. Tuesday: Factory orders and Auto sales. Wednesday: the ADP index, Trade deficit, ISM services and the FED’s beige book. Thursday: weekly Jobless claims. Friday: the Payrolls report, the Unemployment rate, and Consumer credit. The ECB meets on Thursday, and FED governor Powell gives a speech on Friday. Best to your weekend and week!
CHARTS: http://stockcharts.com/public/1269446/tenpp
http://caldaroew.spaces.live.com
After about 40 years of investing in the markets one learns that the markets are constantly changing, not only in price, but in what drives the markets. In the 1960s, the Nifty Fifty were the leaders of the stock market. In the 1970s, stock selection using Technical Analysis was important, as the market stayed with a trading range for the entire decade. In the 1980s, the market finally broke out of it doldrums, as the DOW broke through 1100 in 1982, and launched the greatest bull market on record.
Sharing is an important aspect of a life. Over 100 people have joined our group, from all walks of life, covering twenty three countries across the globe. It's been the most fun I have ever had in the market. Sharing uncommon knowledge, with investors. In hope of aiding them in finding their financial independence.
Copyright © 2014 Tony Caldaro - All Rights Reserved Disclaimer: The above is a matter of opinion provided for general information purposes only and is not intended as investment advice. Information and analysis above are derived from sources and utilising methods believed to be reliable, but we cannot accept responsibility for any losses you may incur as a result of this analysis. Individuals should consult with their personal financial advisors.
Tony Caldaro Archive |
© 2005-2022 http://www.MarketOracle.co.uk - The Market Oracle is a FREE Daily Financial Markets Analysis & Forecasting online publication.