


Stock Market Rally - Is this the End?
Stock-Markets / Stock Markets 2014 Jun 03, 2014 - 10:25 AM GMTBy: John_Rubino

 Eventually, every finance geek learns that calling market tops — at least publicly — is so hard that it’s not worth the reputation risk. This is especially true in an era of pervasive government manipulation, where price distortions can persist for far longer than any kind of rational analysis can justify.
And yet. For US stocks — and by implication most other equity markets — the danger signals are piling up to the point where a case can be made that the end is, at last, near. To take just a few examples of indicators that should scare the hell out of anyone with a big stock portfolio:
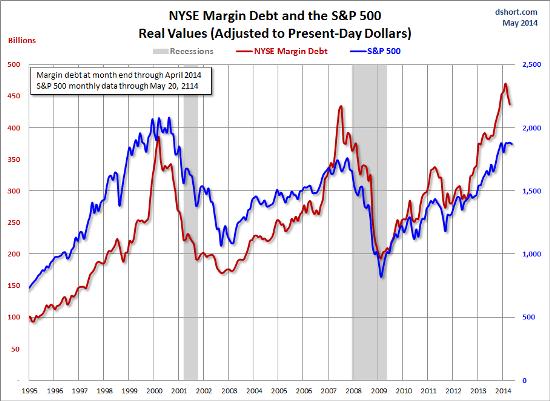
Margin debt has peaked
In good times, optimistic investors tend to borrow money against their stocks to buy more stocks. This “buying on margin” generally goes hand in hand with rising share prices, and tends to peak and then decline just before the markets turn down. As the following chart illustrates, margin debt hit a record in January, turned down in February, and is now falling hard.
Interest rates are plunging
Rising interest rates are generally seen as a sign of a growing economy in which the demand for money is strong. Falling rates point to the opposite. Since equities are valued on future cash flows which in turn depend on future growth, falling interest rates are generally associated with weak equity markets. From Wall Street On Parade:
Is the Market Crazy? Treasurys Are Screaming Crisis While Stocks Yawn
The U.S. Treasury market, which is experiencing a flight to safety (that suggests a slowing economy, lower corporate earnings and thus a lower stock market in the future) is essentially saying that the current composite wisdom of the stock market is either nuts or the market is, indeed, rigged.Stocks have been setting new highs of late while the yields on the benchmark 10-year and 30-year Treasurys decline. The 10-year Treasury began the year at a yield of approximately 3 percent and closed on Friday at a yield of 2.49. The 30-year Treasury started the year at a yield of approximately 4 percent and closed last week with a yield of 3.33 percent.
Market breadth is contracting
In a healthy bull market most stocks move up. This indicator — the percentage of stocks that rise along with the overall market — is known as market breadth, and lately it has turned highly negative. From the above Wall Street On Parade article:
Joseph Ciolli and Lu Wang of Bloomberg News report today that only “1.8 billion shares traded each day in S&P 500 companies last month, the fewest since 2008.” Equally worrying, say the reporters, is that when the S&P 500 index “hit an all-time high on May 23, only about 20 of its 500 companies reached 52-week highs…”
A market index setting new highs while only 20 of its 500 components set new highs, i.e. less than 5 percent, is sounding the same alarm bell as the bond market. The rising tide is not lifting all boats or to put it in Wall Street parlance, this is decidedly weak breadth.
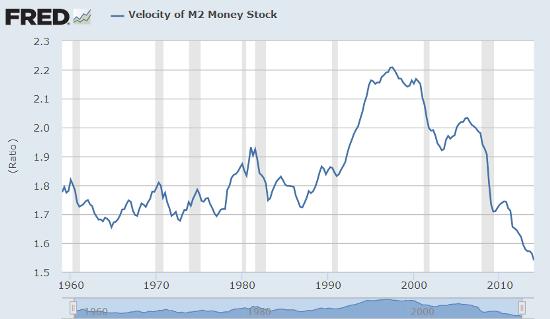
The velocity of money is still plunging
This is a measure of how many times a typical dollar is spent in a given time period. Theoretically, in an optimistic, growing economy, dollars are spent frequently and therefore the velocity of money is high, while in a shrinking economy worried citizens tend to hoard their cash, resulting in a low money velocity. The following chart definitely paints the latter picture, though it has admittedly done so since the 1990s. The question today is whether there’s a point at which all the new dollars being pumped into the system fail to offset consumers’ reluctance to spend their dollars, and where that point might be. The answer is unclear, but the chart still looks ominous.
Now, do these and the many other bear market signals mean the current run is over? Not necessarily, because such indicators apply to normal markets, which this one clearly is not. The world’s governments are actively trying to inflate asset bubbles to make the average person feel rich enough to start spending again (thus sending the velocity of money back up to more traditional levels), and their effectively-unlimited printing presses give them plenty of ammunition. The European Central Bank, for instance, is about to start monetizing eurozone debt on a scale that, if it’s to have an appreciable effect, will be huge. China is easing bank lending standards and talking about other stimulus measures, while Japan’s central bank is buying bonds and encouraging the national pension plan to start buying riskier assets.
One could make the case that the financial markets are responding rationally to the prospect of trillions of new dollars looking for a home in stocks and bonds (and high-end real estate and fine art and the other preferred assets of the 1%). But the case can also be made that all of this manipulation hasn’t really affected fundamentals and that more of the same is unlikely to make much of a difference.
What we’re witnessing, in short, is a truly fascinating attempt by the world’s major governments to suspend the laws that have, thus far in human history, governed economics. And the signs of their imminent failure are spreading.
By John Rubino
Copyright 2014 © John Rubino - All Rights Reserved
Disclaimer: The above is a matter of opinion provided for general information purposes only and is not intended as investment advice. Information and analysis above are derived from sources and utilising methods believed to be reliable, but we cannot accept responsibility for any losses you may incur as a result of this analysis. Individuals should consult with their personal financial advisors.
© 2005-2022 http://www.MarketOracle.co.uk - The Market Oracle is a FREE Daily Financial Markets Analysis & Forecasting online publication.