


Dow Jones Secular Stocks Bull Market Projection
Stock-Markets / Stocks Bull Market Jun 25, 2014 - 02:00 PM GMTBy: Trader_MC

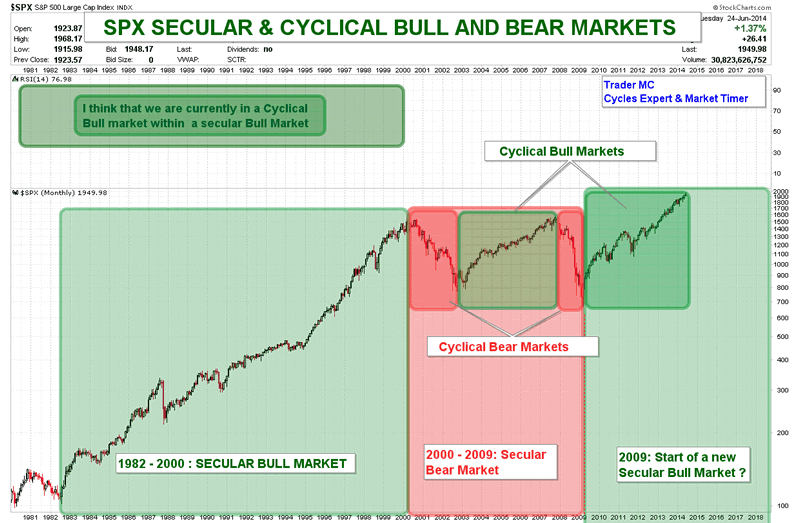
 As an investor and a speculator I am mostly interested in Cyclical Markets (Cyclical Bull or Bear Markets). On average Cyclical Bull Markets last between 4 and 5 years and Cyclical Bear Markets last between 2 and 3 years. Cyclical Markets occur within Secular Markets that define the long term trend. Over the last 100 years, history has shown that the Dow Jones Secular Markets last about 17-18 years on average. For example the Secular Bull Market from 1945 to 1963 lasted 18 years and made over 350% gains, the Secular Bull Market from 1982 to 2000 lasted also 18 years and made over 1000% gains.
The last Secular Bear Market began in March 2000. If it did not already end in March 2009, then 2013 should be the 14th year of this Secular Bear Market. On the other hand, if the Secular Bear Market ended in March 2009, then a new Secular Bull Market began in March 2009 and we are currently in the 5th year of this Secular Bull Market. In that case 9 years were enough for the Secular Bear Market to correct the previous Secular Bull Market of 18 years (1982-2000) - it is a 50% time ratio. The Dow Jones made new highs and is currently about 20% above the high on October 11, 2007 which is the reason why I favor the second possibility and I think that a new Secular Bull Market has begun in March 2009. The market is in a strong impulsive move since March 2009 bottom and I expect the market to continue to climb a "wall of worry" during several years.
On the following chart you can see the Secular and Cyclical Bull and Bear Markets:
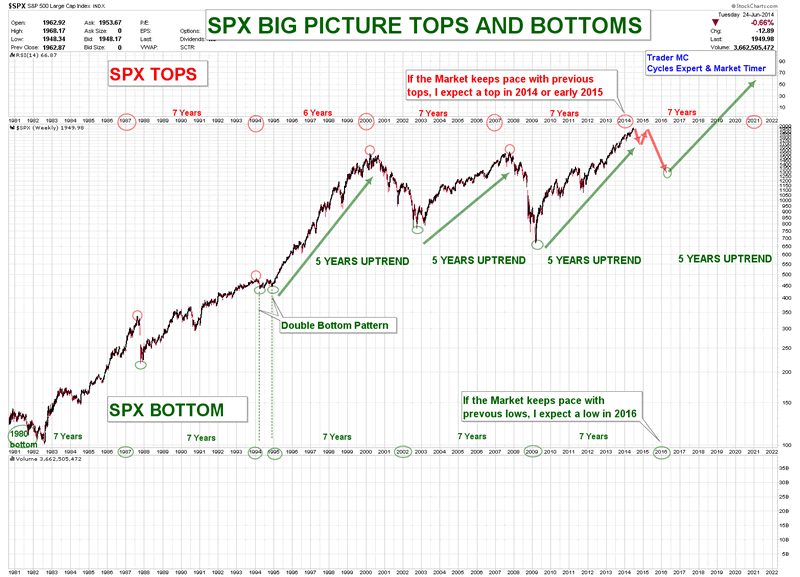
The history of the market shows that the Dow Jones Bull Market often topped between Weeks 261 - 268. Currently at Week 275 from March 2009 low, we should be very close to an intermediate top.
Here is the period duration of Cyclical Bull Markets:
1937 low - 1942 top lasted 268 weeks 1982 low - 1987 top lasted 263 weeks 1994 low - 2000 top lasted 268 weeks 2002 low - 2007 top lasted 261 weeks 2009 low - 2014 top lasted 275 weeks (Jun 24 high)
The Primary Bull Market from major low on December 9, 1974 to major top on Jan 14, 2000 lasted 1305 weeks and had a crash in October 1987, right in the middle of this Bull Market. The Bull Market from October 20, 1987 low to Jan 14, 2000 top lasted 626 weeks which is almost half duration of the Primary Bull Market. History could repeat itself as the Bull Market from Oct 10, 2002 low to Oct 11, 2007 top lasted 261 weeks and the Bull Market from 2009 low until now lasted 275 weeks, having a crash in 2008, right between these Bull Markets. Market likes symmetry both in price and time.
The same thing happened for the Bear Markets. For example, the Bear Market from Jan 14, 2000 top to October 10, 2002 low lasted 143 weeks and the Bear Market from Oct 11, 2007 top to March 6, 2009 low lasted 73 weeks which is 50% of time duration of the previous Bear Market (143/2). History has shown that the Bear Market from Sept 3, 1929 high to July 8, 1932 low lasted 148 weeks which is very close to the duration of the 2000-2002 Bear Market (143 weeks). The Bear Market from Sept 22, 1976 to Mar 1, 1978 lasted 75 weeks which is also very close to the Bear Market from 2007 to 2009 (73 weeks).
The previous examples are showing us that history repeats itself and I am more and more inclined to think that March 6, 2009 low was the beginning of a new Secular Bull Market and that the Bear Market from 2000 high to 2009 low has ended. This Bear Market lasted 9 years (465 weeks for SPX) and looks very similar to the previous Bear Market from Jan 19, 1966 high to Dec 9, 1974 low that also lasted almost 9 years (461 weeks). It is important to keep in mind that the Stock Market movements always anticipate the general economy whether it is a recession or a recovery. That is why the Stock Market is usually not related to the economic news when a major bottom or a major top occurs.
While the majority is looking at the Megaphone Pattern correction since 2000 high and is expecting the market to go back to the lower trendline of this pattern and to make new lows, I think that it will not happen. The opinion of the majority can be used as a contrarian indicator. I think that a healthy correction in this new Secular Bull Market could push the Dow Jones to 12500-13500 (end of 2015 - half 2016) followed by a second leg up of this new Secular Bull Market.
The corrections from low to low during the previous Secular Bull Market and the last Secular Bear Market from 2000 to 2009 lasted between 334 and 444 weeks with an average of 382 weeks.
Here is the time duration of periods between the major lows:
1974 low – 1982 low lasted 400 weeks
1980 low – 1987 low lasted 395 weeks
1987 low – 1994 low lasted 337 weeks
1994 low – 2002 low lasted 444 weeks
2002 low – 2009 low lasted 334 weeks
A major low coming at the end of 2015 or early in 2016 would fit with this 334-444 weeks range.
A top in 2014 and a low in 2016 would also match with an uptrend period of 5 years, with the period of 7 years for a top and also with the period of 7 years for a low:
According to the Elliott Wave Theory impulsive moves are made of 5 waves and I think that the market is very close to finish an extended Wave 3 and to plunge into a corrective Wave 4. As Wave 3 is extended there is a possibility that Wave 5 will be truncated. After Wave 5 I expect the market to plunge into a major low in 2016 to keep pace with its previous lows every 7 years and then to enter a new impulsive leg up for at least 5 years.
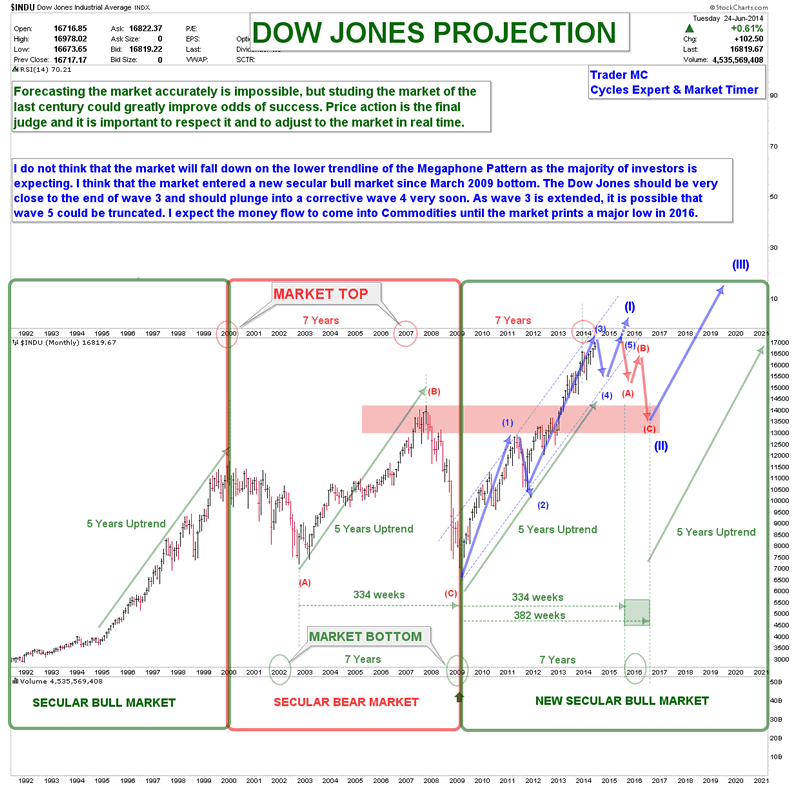
The Dow Jones and the New York Stock Exchange made recently new highs while the Nasdaq, the Russell and the Banks Index did not. Large caps and blue chips are usually the last to be sold before an intermediate correction. This divergence reinforces my view that the market is heading into a corrective Wave 4. Below are the charts of the Nasdaq, the Russell and the Banks Index representing these divergences. You can also notice that these indexes broke below their intermediate channels and backtested them. The Russell and the Banks Index are also forming possible Head and Shoulders Patterns.

Forecasting the market accurately is impossible but studying the market history makes me believe that a new Secular Bull Market has begun in 2009. I think that the money flow will continue going into the Commodities sector until the market bottoms in 2016 but once it will, investors should be back in the Stock Market. The next major low in 2016 could be a once in a generation buy opportunity in the US Market.
Trader MC
Company: Cycle Trader MC OU
Web site: http://tradermc.com
Email: contact@tradermc.com
My analysis covers different assets – Market Indexes, such as US, Europe, Emerging Markets, China, Russia etc., Commodities, Currencies (Forex Trading), Bonds and Rates. In addition to the Markets Updates for MC Members, I also post real-time Trading Alerts for MC Leveraged Members for a more aggressive strategy in all the sectors. Besides the market analysis, this site also contains Cycles Count Updates for all Market Assets, including the Forex Market.
© 2014 Copyright Trader MC - All Rights Reserved
Disclaimer: The above is a matter of opinion provided for general information purposes only and is not intended as investment advice. Information and analysis above are derived from sources and utilising methods believed to be reliable, but we cannot accept responsibility for any losses you may incur as a result of this analysis. Individuals should consult with their personal financial advisors.
© 2005-2022 http://www.MarketOracle.co.uk - The Market Oracle is a FREE Daily Financial Markets Analysis & Forecasting online publication.