


More Stock Market Weakness Ahead?
Stock-Markets / Stock Markets 2014 Jul 14, 2014 - 09:43 AM GMTBy: Andre_Gratian

 Current Position of the Market
SPX: Very Long-term trend - The very-long-term cycles are in their down phases, and if they make their lows when expected, there will be another steep decline into late 2014. However, the Fed policy of keeping interest rates low has severely curtailed the full downward pressure potential of the 40-yr and 120-yr cycles.
Intermediate trend - The DOW may be tracing out an ending diagonal pattern.
Analysis of the short-term trend is done on a daily basis with the help of hourly charts. It is an important adjunct to the analysis of daily and weekly charts which discusses the course of longer market trends.
MORE WEAKNESS AHEAD?
Market Overview
Since I warned of a minor top in my last letter, the SPX dropped 32 points (high to low) but managed to recover some of its loss by closing at 1967 on Friday. This was the minor correction which I had anticipated. However, reading the tea leaves at the end of the week, it is possible (even probable) that another substantial decline could follow. That would still make it a minor correction which might even be followed by another high -- although that remains to be seen! The technical picture of the daily chart has worsened noticeably, to the point where we will have to re-evaluate the weekly trend in another week or so.
Just as it happened before the previous correction, the Russell 2000 (RUT) was the first to take the plunge, closely followed by the American Securities Broker/Dealer (XBD). SPX and DJIA have, so far, followed reluctantly. But the way that RUT closed on Friday is giving us some hints that it might not be over!
On the other hand, NDX is hovering around its all-time highs and does not seem too concerned that a reversal may be coming, so we'll have to see who is sending out the right message. We can't depend on the VIX to do that. It is still half asleep and near its lows!
RUT and XBD have usually been right, so I'll listen to them. Also, my SPX daily indicators are in a poor technical condition with no sign of improvement at the close of the week. So my advice is: bulls be cautious! As for the timing, there is a CIT (change of trend) that was either due at the close of Friday, or Monday morning - if it does not flip-flop as these are often prone to do.
Chart Analysis
If everything unfolds as expected, we'll take a good look at the weekly chart next week. For now, the Daily SPX chart has sufficient technical information to support my views.
If we were to have a decent correction from 1995, it would probably compare to the one that took place from 1897. In fact, since it would correct a bullish phase of about the same length, we could also expect a correction of approximately the same length. There is plenty of evidence that this is very likely to take place.
We have already broken three trend lines from 1862. When the third trend line is broken, it is usually the start of a correction (the fan principle). All we now need to do is to break the trend line from 1814 to 1862 to confirm that we have started more than a simple pull-back. Closing below the red horizontal line (1952) should get things going.
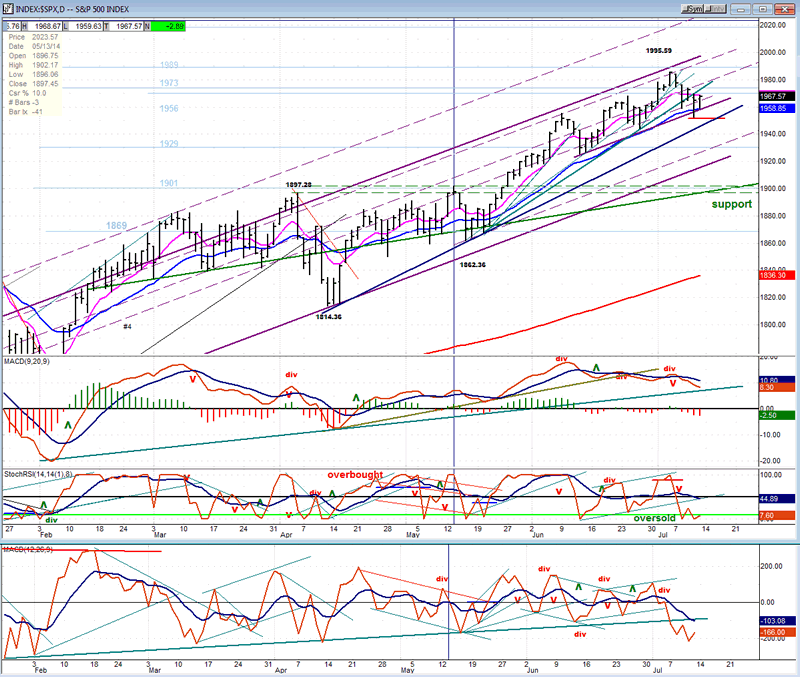
The oscillators have already signaled a longer correction, especially the lowest (A/D) oscillator. It has now spent a whole week below the trend line which originated in early February. As you can see, that trend line stopped the decline in this index at least four times since then. It corresponds to the price trend line drawn between 1738 and 1814 and is, therefore, an important break. Note that the MACD is getting ready to do the same. Another day or two of weakness, and it will go through its trend line. Since the CIT currently due should favor a high, by Tuesday or Wednesday the MACD trend line will be broken and it should have confirmed the A/D oscillator break.
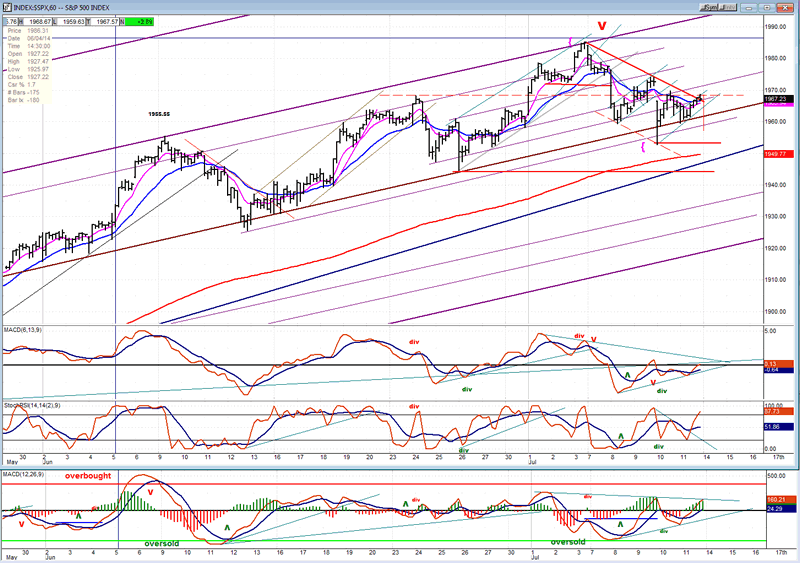
The hourly chart shows clearly how upside momentum was quickly halted by the purple parallel which had done this twice before to previous rallies. The pull-back twice found support on a lower purple parallel which had also halted previous declines, but the second rally from that purple trend line was a sluggish slog which finally made it to the top of the declining trend line. When that lower support line is tested once again, there is a good chance that it will give way and allow prices to drop to the trend line discussed earlier (between 1738 and 1814) which parallels the 200-hr MA and should offer temporary support.
The oscillators are all in an uptrend, something which would suggest an uptrend in price, but this is only a bounce from an oversold condition. There is no strength in the price pattern and, in any case, the hourly oscillators are subservient to the daily ones which are very weak.
Cycles
I had expected the 10-wk and 22-wk cycles to be making a low last week, but I am wondering if the 22-wk cycle did not invert by peaking the week before instead, and is not responsible for the decline which appears to have just started...
Breadth
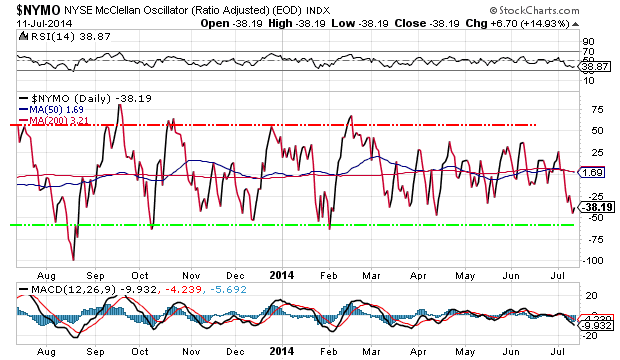
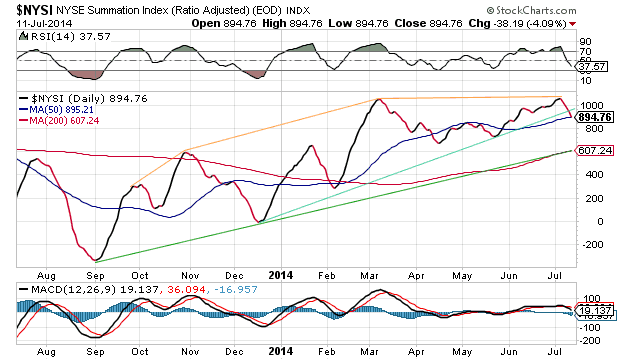
The McClellan Oscillator and the Summation Index appear below (courtesy of StockCharts.com).
I commented on the weakness of the McClellan oscillator in the past two letters, mentioning that it remained barely positive in spite of the fact that the SPX was making new highs. Not surprisingly, this pattern has given way to a sharp drop into negative territory this past week, with no sign of a bounce in sight. As a result, the Summation index has also reversed and just broke the trend line that goes back to December of last year. That line corresponds to the 50 DMA on which NYSI is currently resting. Considering the angle of attack, it will probably go through it next week. The decline in NYSI has also sent its RSI in a sharp decline which has not yet reached the oversold level.
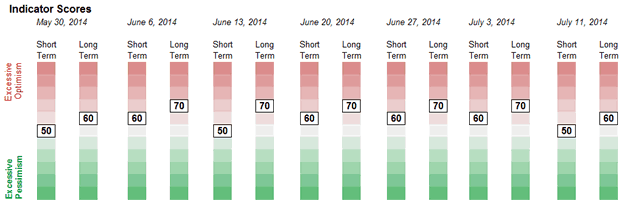
Sentiment Indicators
After a minor correction in the indices, the SentimenTrader (courtesy of same) long term indicator has dropped back to 60, which is normal. If it should drop even further, it would be bullish for the market.
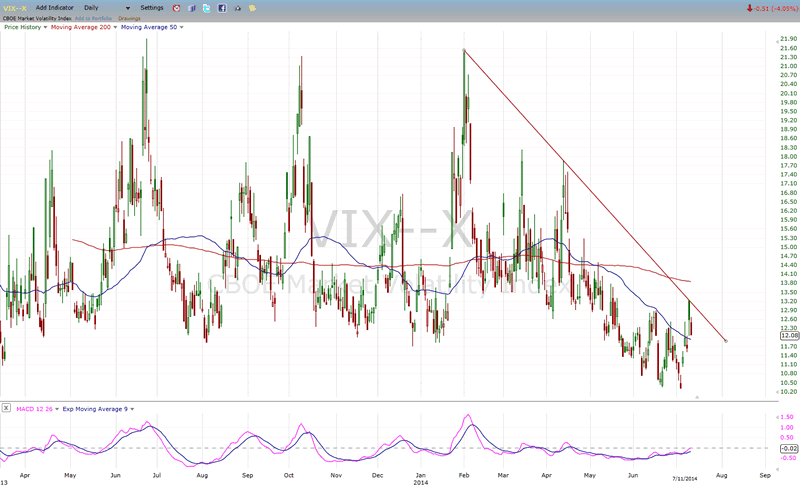
VIX (CBOE volatility Index)
During the correction, VIX did rally off its low but stopped at the short-term downtrend line. Its position on this chart, offers little in terms of predicting where the market is going to go from here. If it does break through its trend line, it will be because the market is continuing its decline, and that will be self-evident. However, if we turn to the P&F chart, it has broken above a short-term base, which indicates that the odds of some follow-through have improved, with a potential target to 16/16.50.
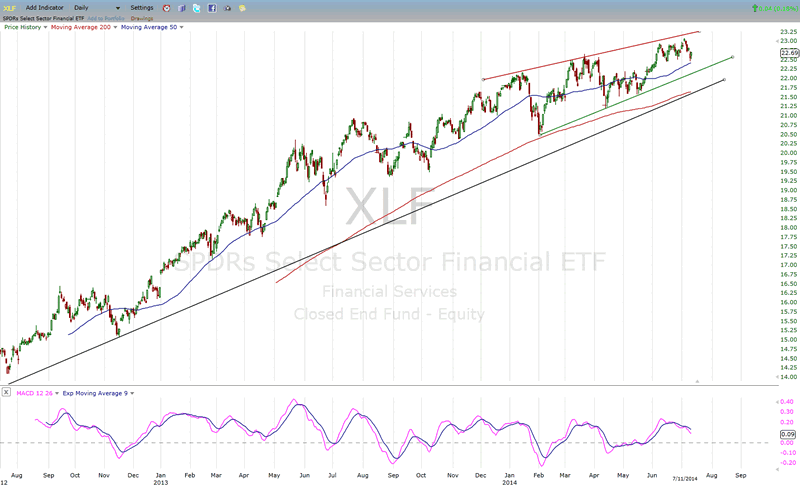
XLF (Financial ETF)
XLF continues to trade in sync with the market, staying a notch behind the SPX in relative strength. The last move found support on the 50-DMA. A move below before moving up is needed if it is going to challenge its intermediate trend line. Like many other indices, there is a hint of deceleration in the long-term trend which could be the prelude to a significant correction.
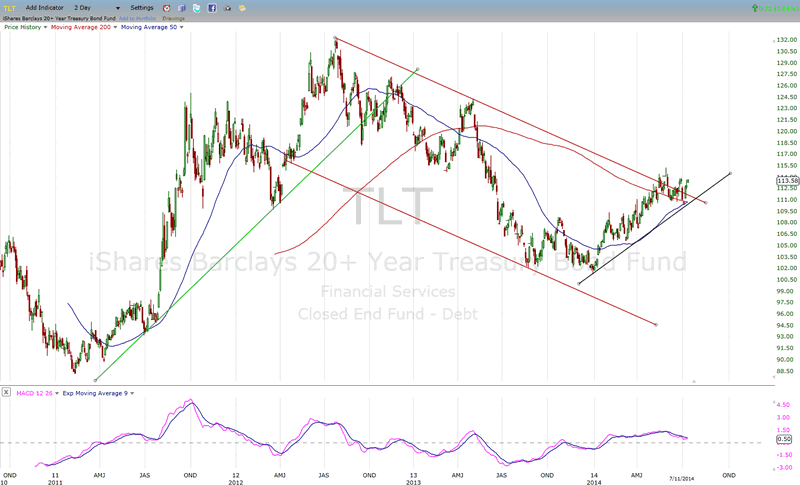
TLT (20+yr Treasury Bond Fund)
TLT has moved out of its downtrend line for the third time and may now be in a position to extend its move upward, especially if SPX continues to correct. If there is follow-through, there is a potential P&F target to 117 and a little higher.
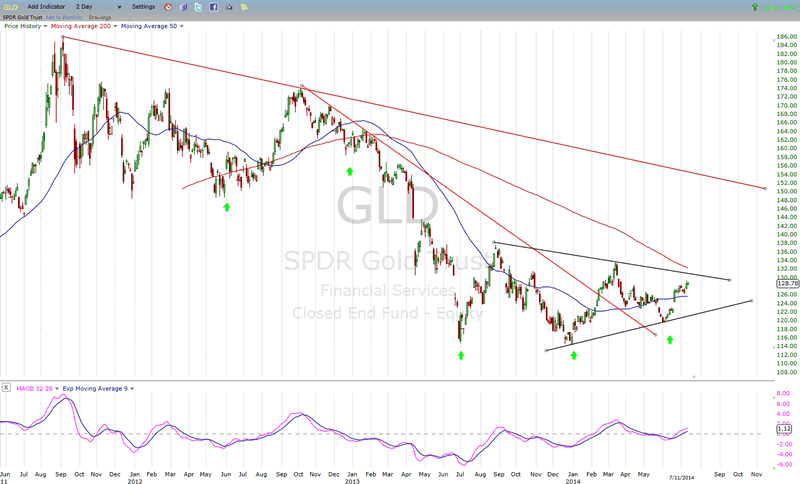
GLD (ETF for gold)
If it cannot break through its sloping downtrend line, GLD may be in the process of forming a triangle. This would be bad news for the bulls, since it would indicate that the up-phase of the 25-wk cycle is too weak to push it through resistance in order to continue its uptrend. We need to give it a little more time. The short-term base does not forecast a move beyond 132 at most. But if it can go beyond 134, a longer count would kick in with the possibility of significantly higher prices.
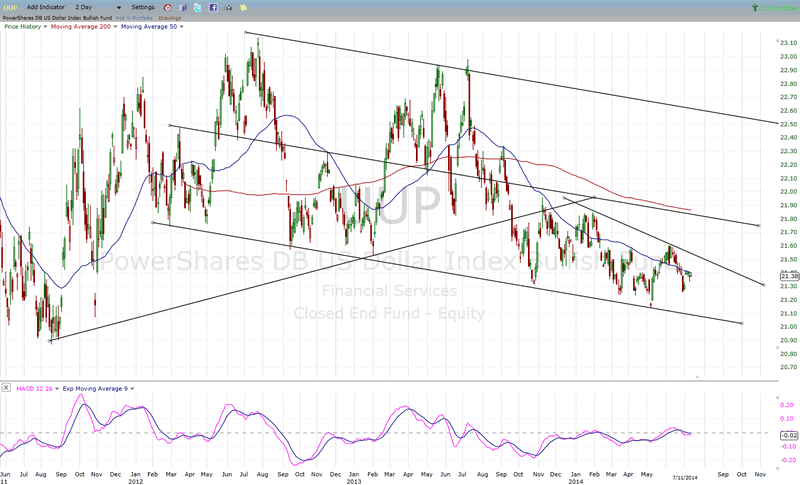
UUP (dollar ETF)
UUP is, to a large, extent dependent on what Gold does - or perhaps it's the other way around! They both seem to be affected by the same 25-wk cycle. It is too soon to determine what effect the up-phase of the cycle is having on GLD. When that becomes clear, we will be in a better position to determine the fate of UUP.
USO (US Oil Fund)
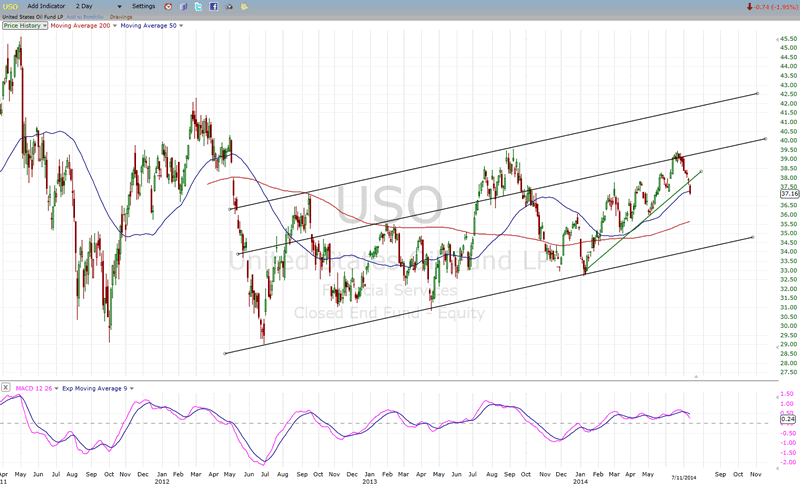
USO has not been able to move above an inner parallel line which provided resistance. If it continues to decline beyond the 50-DMA, it will most likely seek support on the longer MA. It's too soon to say with conviction that its attempt at moving to the top of its channel has failed.
Summary
Based on the weak condition of the daily indicators, the odds favor that the SPX will continue its decline. A break below last week's low would warn of a much more substantial correction. Already some clear and valid projections are in place if this should happen. They will be given to subscribers as early next week, including those that subscribe on a trial basis.
FREE TRIAL SUBSCRIPTON
If precision in market timing for all time framesis something that you find important, you should
Consider taking a trial subscription to my service. It is free, and you will have four weeks to evaluate its worth. It embodies many years of research with the eventual goal of understanding as perfectly as possible how the market functions. I believe that I have achieved this goal.
For a FREE 4-week trial, Send an email to: ajg@cybertrails.com
For further subscription options, payment plans, and for important general information, I encourage
you to visit my website at www.marketurningpoints.com. It contains summaries of my background, my
investment and trading strategies, and my unique method of intra-day communication with
subscribers. I have also started an archive of former newsletters so that you can not only evaluate past performance, but also be aware of the increasing accuracy of forecasts.
Disclaimer - The above comments about the financial markets are based purely on what I consider to be sound technical analysis principles uncompromised by fundamental considerations. They represent my own opinion and are not meant to be construed as trading or investment advice, but are offered as an analytical point of view which might be of interest to those who follow stock market cycles and technical analysis.
Andre Gratian Archive |
© 2005-2022 http://www.MarketOracle.co.uk - The Market Oracle is a FREE Daily Financial Markets Analysis & Forecasting online publication.