


Here's Why Trendlines are Your New Trading Best Friend
InvestorEducation / Learn to Trade Sep 18, 2014 - 04:48 PM GMTBy: EWI

 See how trendlines help you make calculated trading decisions
Have you ever seen Donald Duck play pool? Trust us, it isn't pretty.

An expert pool player, on the other hand -- well, he can just look at the billiards table and imagine lines drawn out, marking the trajectory the cue ball must take to make the shot.
Now, what if you could just look at a financial market's price chart -- and see actual lines drawn out that aim straight for the "pocket" of opportunity?
According to our resident Monthly Commodity Junctures editor and chief commodity analyst Jeffrey Kennedy, you can.
All you need to do is implement a tried-and-true tool of technical analysis known as trendlines. (And let's just say, what Paul Newman is to the game of pool in the Hustler, Jeffrey Kennedy is to the field of technical analysis in real life.)
In part 1 of our series, we showed you how Jeffrey used trendlines to identify a major break-out point in cocoa back in May 2014. Part 2 played the video of Jeffrey's April 2014 corn forecast, where he used trendlines to fortify his bearish wave count -- right before corn prices embarked on a powerful sell-off to 4-year lows.
Today, we're returning to that April 2014 Monthly Commodity Junctures video to show you 3 more examples of how Jeffrey used trendlines to "call the pocket" in coffee, sugar, and the U.S. dollar. Roll the tape!
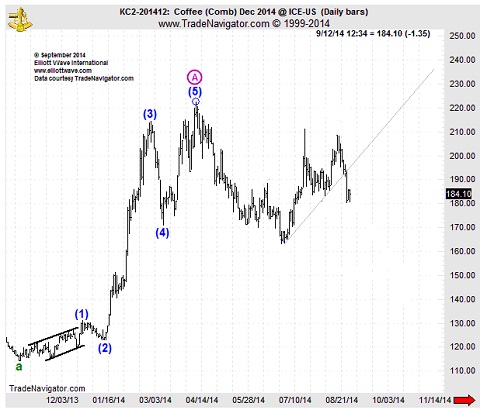
Of coffee, Jeffrey said: "We can expect a counter-trend move back to near the previous fourth wave extreme, roughly say between 170 and 160.
Coffee prices indeed sold off in three waves (i.e. counter-trend action) to the "previous fourth wave extreme" after breaking through the lower boundary of the trend channel:
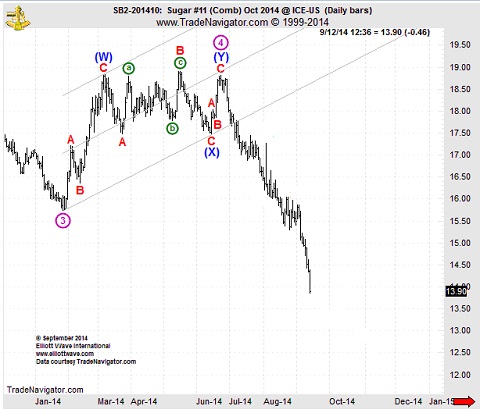
Of sugar, Jeffrey said: "Once complete, wave (Y) of the larger fourth wave will give way to additional selling to back below the actual 2014 low."
Here's what happened to sugar prices after they fell below their trendline:
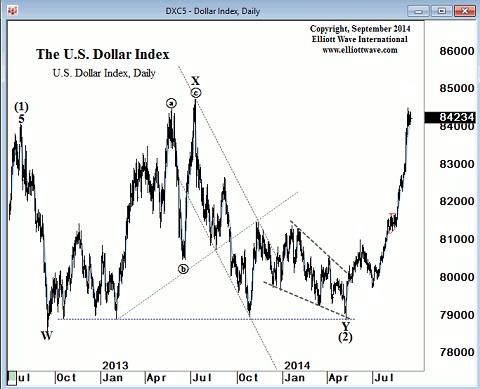
Of the U.S. dollar, Jeffrey said: "Ideally we'll begin to see this third wave move [up] develop soon... in a nice, volatile move to the upside."
The dollar indeed rallied strongly off that trendline:
It's safe to say, once you truly understand the risk-managing power of trendlines, they will become one of the most valuable tools in your technical toolbox. And nobody can attest to that fact more than Jeffrey Kennedy.
In fact, Jeffery loves trendlines so much, he wrote a book about them. Well, a free eBook -- titled "Trading the Line: 5 Ways You Can Use Trendlines to Improve Your Trading."
As the title of Jeffrey's eBook states, there are 5 ways trendlines improve your trading:
- Trendlines show you the dominant psychology of investors, be it bullish or bearish
- They define your risk via support and resistance price levels
- They give you advanced warning of potential price breakout points
- They help you identify critical moments in time
- Trendlines also tell you when the trend has turned
Want to learn how to draw your own trendlines -- and gain an advantage you've never had before?
This article was syndicated by Elliott Wave International and was originally published under the headline Here's Why Trendlines are Your New Best Friend, Part 3. EWI is the world's largest market forecasting firm. Its staff of full-time analysts led by Chartered Market Technician Robert Prechter provides 24-hour-a-day market analysis to institutional and private investors around the world.
About the Publisher, Elliott Wave International
Founded in 1979 by Robert R. Prechter Jr., Elliott Wave International (EWI) is the world's largest market forecasting firm. Its staff of full-time analysts provides 24-hour-a-day market analysis to institutional and private investors around the world.
© 2005-2022 http://www.MarketOracle.co.uk - The Market Oracle is a FREE Daily Financial Markets Analysis & Forecasting online publication.