


What Cycles Reveal About Stock Market Crash
Stock-Markets / Financial Crash Sep 26, 2014 - 06:29 PM GMTBy: Harry_Dent

 You can’t compare favorable geopolitical cycles (such as the 1983 to 2000) to unfavorable cycles (2001 to 2019). It’s like comparing apples to oranges.
A case in point is comparing demographic and generational boom periods, such as 1983 to 2007 to a down cycle like the one we’re in now which will come to an end in approximately 2020.
Even though Price-Earning ratios (P/E ratios) aren’t as high as they were when the bubble peaked in early 2000, it doesn’t mean that stocks aren’t overvalued.
I think that it makes more sense to compare 2014 with peaks in the past like in 2007 because those spikes occurred in adverse geopolitical periods like todays. But perhaps late 1972 is the best year for comparison as we were already past the peak of the demographic cycle and in an adverse geopolitical cycle.
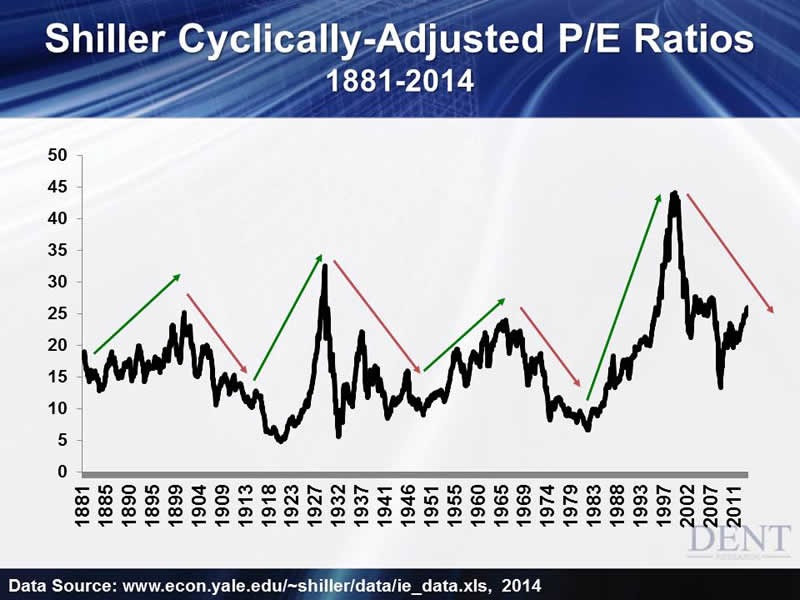
The chart above shows how P/E ratios for stocks were adjusted taking into consideration the cyclicality of earnings. Even though valuation is imperfect, normal P/E ratios often get understated near market tops due to strong surges in earnings. But these surges reverse and get even more exaggerated when earnings crash briefly like they did in 2009.
We get a much clearer view of stock valuations over time because Shiller shows us a 10-year average of earnings that have been inflation adjusted.
His model shows that P/E ratios are near 27 in 2007 and higher than all major tops with the exception for the ones in 1929 and in 2000. In late 1972, the best comparison of Shiller’s P/E was only 18. With those numbers, this chart clearly shows that stocks are overvalued.
History is cyclical… you can’t see it as one straight-line of incremental progress and because of the peaks and valleys of cycles, you can understand why stock valuations were the highest during the greatest bubbles of late 1929 and early 2000. I added the green and red arrows to depict the favorable and unfavorable spans on my geopolitical cycle to further illustrate this point.
In deflationary (winter) seasons like 1930 to 1942, P/E ratios on stocks dropped from 32.6 in late 1929 to its lowest point in late 1932… 5.6. It had only climbed three points in 1942 to 8.6 when the next sustained bull market started.
It’s the rapidly growing risk premium, not the drop in earnings that investors bring on when they suddenly flip from giddy to fearful. P/E ratios dropped to 8.2 during the summer in late 1974 and then dipped further in late 1982 to 6.6.
We would expect P/E ratios to be declining as risks grow in this geopolitical cycle that’s paired up with a deteriorating demographic cycle. The ratios won’t climb as high as they did in early 2000 or in 1929 when the world was living through not only a positive geopolitical cycle but was also experiencing one of the strongest parts of the demographic spending trends.
P/E ratios are also higher now at 19 on the S&P 500 in normal measures and at similar levels at 27 in Shiller’s model when the last bubble peaked in late 2007. I know economists didn’t see that one coming either.
Today’s reading is higher than many dates from the past and as high as 2007. Yet all of these peaks were followed by hard crashes… some by as much as 50%. This current bubble is more extreme and exponential and it’s looking more and more like the one from 2000.
Now that investors have nowhere else to go with their money and are convinced that the Fed will not let the market fall, all we need is for something to go wrong and flip them from their sense of false security into extreme fear like in late 2008. If we had a drop in P/E ratios similar to the drop in 1974, it would result in a 58% decline in stocks as well as a sharp decline in earnings.
Keep in mind that bubbles don’t correct like normal bull markets… they crash. So, I’m not in that minority camp that expects a 10% to 20% correction over the next year or two. I’m looking for something closer to 65%, which makes the landscape look more like the devastating 2008/2009 crash. Do you think that the markets would reward governments for creating a totally artificial recovery through free money?
It’s frustrating that this bubble just keeps edging up as governments keep fueling it. This burst will happen sooner than later and it’ll likely be rapid when it starts after so much stimulus and manipulation. It’s only pushed up this market leaving it little chance to correct and consolidate.
Before the mid-2000s, the Nasdaq crashed 40% in the first few months when reality collided with delusion.
Markets look like they are due for another correction late this month. We could see one more rally after that before they peak — maybe… maybe not. But it looks like the markets are getting very close to the beginning of the next even greater crash.
Harry
Follow me on Twitter @HarryDentjr
Harry studied economics in college in the ’70s, but found it vague and inconclusive. He became so disillusioned by the state of the profession that he turned his back on it. Instead, he threw himself into the burgeoning New Science of Finance, which married economic research and market research and encompassed identifying and studying demographic trends, business cycles, consumers’ purchasing power and many, many other trends that empowered him to forecast economic and market changes.
© 2005-2022 http://www.MarketOracle.co.uk - The Market Oracle is a FREE Daily Financial Markets Analysis & Forecasting online publication.