


Stock Market Primary IV Underway
Stock-Markets / Stock Markets 2014 Oct 11, 2014 - 12:11 PM GMTBy: Tony_Caldaro

 Another wild and volatile week. The week started off calm enough, for this market, with a continuation rally gap up on Monday as the SPX hit 1978 in the first few minutes. Then the market declined to a slightly lower low for the downtrend at SPX 1925 by Wednesday morning. Wednesday afternoon, however, the market rocketed to SPX 1970 just before the close. Then after a quiet opening on Thursday the market gave it all back and made new downtrend lows on Friday. For the week the SPX/DOW lost 2.9%, the NDX/NAZ lost 4.2%, and the DJ World index lost 2.8%. Economic reports for the week were light, but decidedly negative. On the downtick: consumer credit, export/import prices, the WLEI and investor sentiment. On the uptick: wholesale inventories. Next week we get the FED’s Beige book, retail sales, industrial production, reports on housing, and it’s options expiration Friday.
LONG TERM: bull market
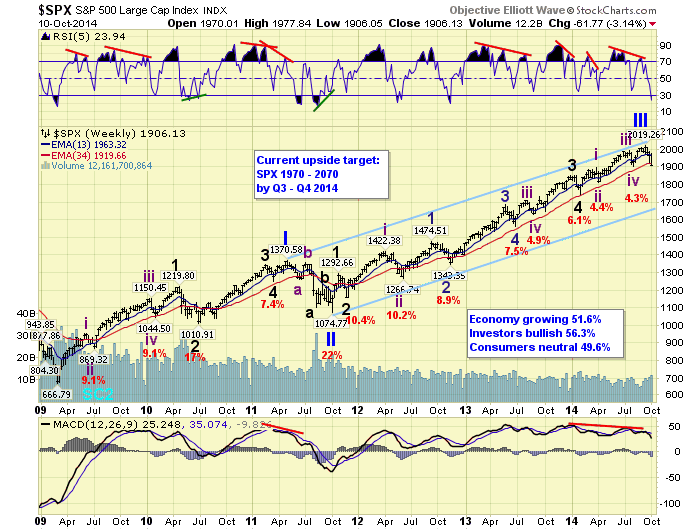
The five primary wave bull market continues, but we appear to be in correction mode now. Primary waves I and II ended in 2011, and Primary III appears to have recently ended in September. This suggests a potentially nasty Primary wave IV is currently underway. We counted Primary I as five Major waves with a subdividing Major wave 1, and simple Major waves 3 and 5. We counted Primary III as five Major waves as well, but with a simple Major wave 1, and subdividing Major waves 3 and 5. During Primary III Major waves 1 and 2 ended in late 2011, and Major waves 3 and 4 ended in early 2014. Major wave 5 divided into five Intermediate waves, with the fifth wave ending on September 19th.
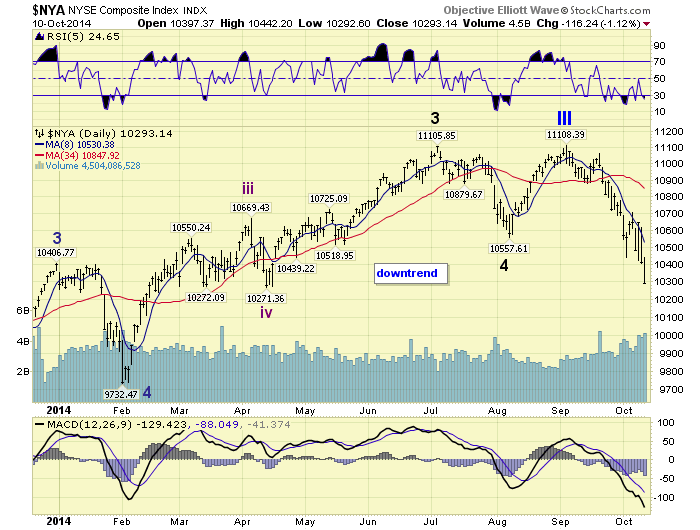
Last weekend we pointed out several reasons why we expected Primary IV to be underway. The market had closed last Friday only about 2.5% off the all time high. We displayed charts of the NYSE, the DJ World index, and the R2K. All three had topped either in July or September and had already fully retraced their most recent uptrend. We also displayed how market breadth was declining despite the fairly significant rallies since September 19th. We also displayed how volatile Primary wave II was during its initial stages. Now the NYSE has nearly fully retraced the past two uptrends in only five weeks.
Since the September 19th all time high we have been in a downtrend, which has nearly fully retraced the entire Int. v uptrend. This suggests we have entered Major wave A, of a three Major wave, Primary IV. When Primary IV does conclude we should get a rising Primary wave V to all time new highs. The size of the Primary IV correction should help determine to length and duration of the Primary wave V to follow. A shallow Primary IV should lead to a short and quick Primary V. A steep and lengthy Primary IV should lead to a long and strong Primary V.
MEDIUM TERM: downtrend
Since second and fourth waves of bull markets are typically similar. A review of Primary II will helps us in determining what to expect during Primary IV. Primary II took five months to unfold, ended in an elongated flat, (similar to the 1987 crash), as the market lost 22% of its value. Since that wave formation was a flat we would expect a zigzag to unfold for Primary IV (alternation). The first two down legs of the Primary II correction would fit this scenario. They are easily observed in the weekly chart above.
Notice how the weekly RSI dropped to quite oversold during both of those declines. And, the MACD turned negative before the correction was over. Notice where we are now. Barely oversold on the RSI and still quite high on the MACD. This suggests not only are we in Major wave A, but Major wave C should take this market much, much lower. Since Major wave 5 was stronger than Major 1, we would expect support to be found at previous fourth waves of a lesser degree. The three levels we are looking at for a potential Primary IV low are: SPX 1738, SPX 1627 and SPX 1560; Major 4, Intermediate iv, and Minor 4 of Primary wave III.
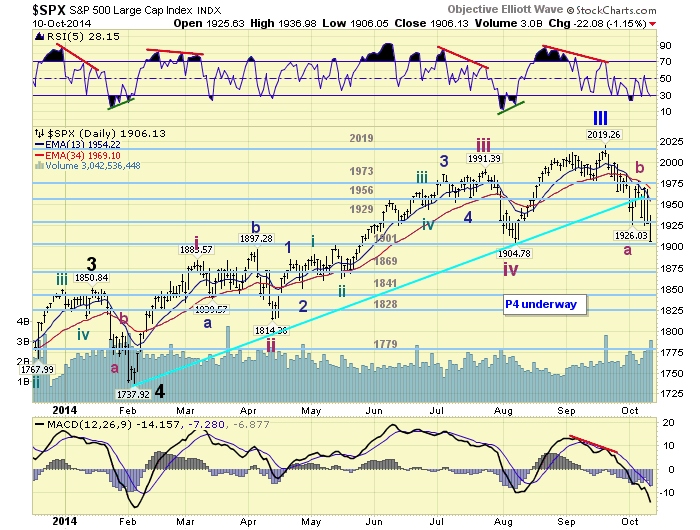
The current downtrend, Major wave A, is dividing into three Intermediate waves. Intermediate wave A ended at SPX 1926, Intermediate wave B ended at 1978, and Intermediate wave C has been underway since then. We will get into more detail on this downtrend below. Medium term support is at the 1901 and 1869 pivots, with resistance at the 1929 and 1956 pivots.
SHORT TERM
Intermediate A divided into three Minor waves: 1964-1985-1926. Notice how Minor a was a bit complex, and Minor c was simple. Then we had a strong simple rally for Intermediate B to SPX 1978. Intermediate C starts off with a simple decline to Minor a at SPX 1925, a strong rally to SPX 1970 for Minor b, and now we should get a somewhat complex Minor c. Which has already begun. What is also interesting about this downtrend is that many of the moves are approximately 55 points. Minors a and c of Int. A, Int. B, Minor a of Int. C, and now, Minute a of Minor c. Also two of the counter rallies, Minor b of Int. A, and Minute b of Int. C are approximately 21 points.
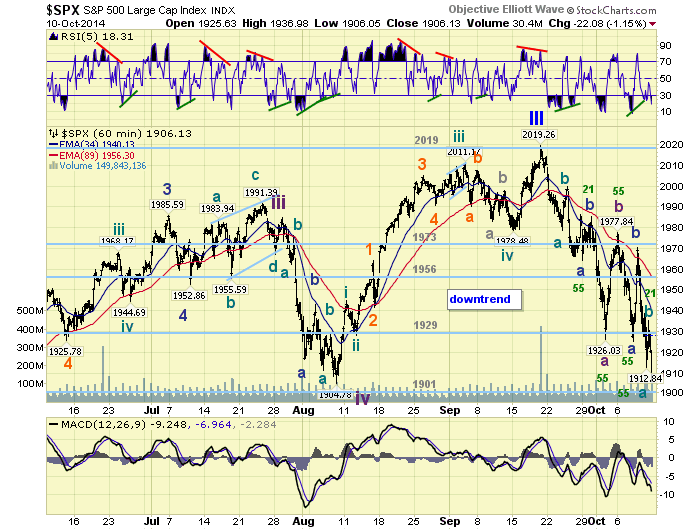
Since we are now, theoretically, in the last wave down of Major wave A. And we have several completed waves we can make some more precise Fibonacci calculations for its potential end. We first have a cluster of price/wave relationships between SPX 1879-1885. Next is the 1869 OEW pivot. After that we have another price/wave relationship right at the OEW 1841 pivot, and finally another at the OEW 1828 pivot. So with the exclusion of SPX 1879-1885 Major A should end at one of the three pivots under 1901. Since this downtrend has essentially moved pivot to pivot, i.e 1901, 1929, 1956, 1973 and 2019. It is likely to end at a pivot as well. We have an idea of how this last wave should unfold and will keep everyone updated in the daily updates. Short term support is at the 1901 pivot and SPX 1879/1885, with resistance at the 1929 and 1956 pivots. Short term momentum appears to be trying to set up a positive divergence again.
FOREIGN MARKETS
The Asian markets were mostly lower for a net loss of 1.0%.
The European markets were all lower losing 4.2% on the week.
The Commodity equity group were mixed for a net loss of 1.6%.
The DJ World index continues in a downtrend losing 2.8% on the week.
COMMODITIES
Bonds continue their uptrend gaining 1.2% on the week.
Crude continues its downtrend losing 4.7% on the week.
Gold remains in a downtrend but gained 2.7% on the week.
The USD may be in, or getting close to, a downtrend losing 0.9% on the week.
NEXT WEEK
Wednesday: Retail sales, the PPI, the NY FED, Business inventories and the FED’s Beige book. Thursday: Industrial production, weekly Jobless claims, the Philly FED, and the NAHB. Friday: Housing starts, Building permits, Consumer sentiment, Options expiration, and a speech by FED chair Yellen at 8:35. Busy mid to end of week. National holiday on Monday, but equity markets will be open. Best to your weekend and week!
CHARTS: http://stockcharts.com/public/1269446/tenpp
http://caldaroew.spaces.live.com
After about 40 years of investing in the markets one learns that the markets are constantly changing, not only in price, but in what drives the markets. In the 1960s, the Nifty Fifty were the leaders of the stock market. In the 1970s, stock selection using Technical Analysis was important, as the market stayed with a trading range for the entire decade. In the 1980s, the market finally broke out of it doldrums, as the DOW broke through 1100 in 1982, and launched the greatest bull market on record.
Sharing is an important aspect of a life. Over 100 people have joined our group, from all walks of life, covering twenty three countries across the globe. It's been the most fun I have ever had in the market. Sharing uncommon knowledge, with investors. In hope of aiding them in finding their financial independence.
Copyright © 2014 Tony Caldaro - All Rights Reserved Disclaimer: The above is a matter of opinion provided for general information purposes only and is not intended as investment advice. Information and analysis above are derived from sources and utilising methods believed to be reliable, but we cannot accept responsibility for any losses you may incur as a result of this analysis. Individuals should consult with their personal financial advisors.
Tony Caldaro Archive |
© 2005-2022 http://www.MarketOracle.co.uk - The Market Oracle is a FREE Daily Financial Markets Analysis & Forecasting online publication.