


How to Recognize a Stock Market “Bear Raid” on Wall Street
Stock-Markets / Stock Markets 2014 Oct 30, 2014 - 07:34 PM GMTBy: Gary_Dorsch

 October has a reputation as a graveyard for many Bull markets, a reputation that was enshrined by the “Black Monday,” Crash in October 1987, when the Dow Jones Industrials plunged -22% in a single day. And then again in October 2008, the Dow plummeted -3,000-points from as high as 10,882 on Oct 1st to as low as 7,882 hit on Oct 10th. The Dow ended the brutal month of Oct 2008, with a loss of -2,675 points, or -14.1% for the month. The S&P-500 Index fared worse, with a -17% decline, - the worst since the -23% drop in October 1987. Paper losses in US-stocks came to $2.5-trillion for the month. Emerging markets suffered even more, shedding -29%.
October of 2008 saw five of the ten worst daily declines in the history of the Dow Industrials, including several knee-buckling plunges, such as the -8% drop on Oct 9th, an even-bigger -9% fall on Oct 15th, followed by a -6% slide on Oct 22nd. On Oct 24th, Japan's Nikkei index plunged -9.6%; India’s Sensex index dropped -11%; Brazil’s Bovespa index fell -6.9%. Worldwide, equity markets lost $16.3-trillion.
Go back further, to the Asian currency crisis, and the Dow plunged -554 points on Oct 27th, 1997. And there is the October 1929 stock market crash that set off the Great Depression. No wonder people think October is a “jinxed” month for the market. However, since the Crash of 1987, -- October has been the third best-performer -with gains of +1.8%, on average, and finishing up 70% of the time. The S&P-500 index has gained at least +3.8% in three of the last four Octobers.
Yet October and the summer months preceeding it, had more than their fair share of so-called “Bear Raids” or sudden, sharp panic attacks, that frighten many investors into selling their shares in order to avoid losses to their retirement accounts. During a “Bear Raid,” quick footed short sellers seize upon news items, such as financial turmoil overseas, that is largely unexpected, or “Black Swan” events that are far outside of the realm of probabilities. The objective of a “Bear Raid” is to make windfall profits within a brief time period through short sales. If the Bear Raid is successful and the target stock plunges, short sellers can buy the shares cheaply on the open market. These shares would be used to replace the ones that were borrowed earlier and sold at a much higher price, with the short sellers pocketing the difference as their profit.
Bear Raiders must closely monitor the number of short positions in the target stock, or exchange trade fund, (ETF), since a huge short interest increases the risk of a short squeeze that can inflict substantial losses on the Bears. These short sellers cannot afford to wait patiently for many weeks or months until their short strategy works out. They must act to cover their short positions, before other investors see the beaten down market as a bargain.
If operating in the US’s centrally planned market, where the Fed is actively intervening to prevent sharp downturns, the Bear Raider knows the gains from the short sale trade will eventually be reversed, and usually within short order. Once Bullish investors begin to realize that they were hoodwinked, and scared out at the lows, - they begin to pile back into stocks again at higher prices. What usually follows is an eventual recovery of all the previous losses that were engineered by the Bear Raiders.
“Bear Raids” have been a part of the US-stock market’s folklore for more than a decade. Throughout history, investors have blamed short sellers for some of the worst crashes in the world’s financial markets. Jesse Livermore was said to have pocketed $100-million in profits from shorting the stock market during the Crash of 1929. Before his death, Livermore wrote a book titled, “How to Trade in Stocks,” in which he described the dynamic of a “Bear Raid” as follows; “The theory is that most of the sudden declines or particular sharp breaks are the results of some plunger’s operations. The excuse for losses that unfortunate speculators so often receive from brokers and financial gossipers serves merely to keep you from wisely selling short. The natural tendency when a stock breaks badly is to sell it. There is a reason -- an unknown reason but a good reason; therefore get out. But it is not wise to get out when the break is the result of a raid by an operator, because the moment he stops the price must rebound,” -- Jesse Livermore, “Reminiscences of a Stock Operator.”
Jesse Livermore famously warned his readers that “the stock market is designed to fool most of the people, most of the time.” Yet “All through time, people have basically acted and re-acted the same way in the market as a result of: greed, fear, ignorance, and hope – that is why the chart patterns recur on a constant basis.” This axiom has withstood the test of time, and the recurring pattern of a Bear Raid followed by an equally quick recovery rally has been played out on numerous occasions on Wall Street. The recovery rallies are engineered by the Fed, in what’s been dubbed as the “Put Option.”
The Bear Raid of October 1997 – from Thailand to Wall Street, One of the most famous Bear Raids on Wall Street occurred in October 1997, in which short sellers took advantage of the extreme turbulence rippling across the markets in Asia, that ultimately greased the skids for a stunning -15% slide in the Dow Jones Industrials. In spring 1997, corporate treasurers and bank traders in Thailand, the Philippines, Malaysia, and Indonesia were rushing to convert their local currencies into US-dollars. The peso, ringgit, rupiah, and won were toppled like dominos. Currency turmoil erupted. Foreign investors panicked in unison and withdrew money from all investments, -good or bad. When capital started to flow out of the region, monetary authorities raised interest rates to defend their currency pegs, and in turn, caused their local stock markets to collapse.
Once Thailand decided to float its currency baht in July 1997, other Asian currencies came under speculative attack. Although the Hong Kong Monetary Authority <HKMA> was armed with $80-billion of foreign currency reserve, the HK$ was not immune to the regional nightmare. The first attack on the HK$ peg began in October 1997. The HKMA promised to protect the currency’s fixed rate at HK$7.8 /US$, it sold US$1-billion, and on October 15th, the HKMA hiked its overnight interest rates from 8% to 23%. In turn, the interest rate on Hong Kong’s 3-month Libor rate quickly shot-up to as high as 18% on October 24th, from 6.75% a week earlier.
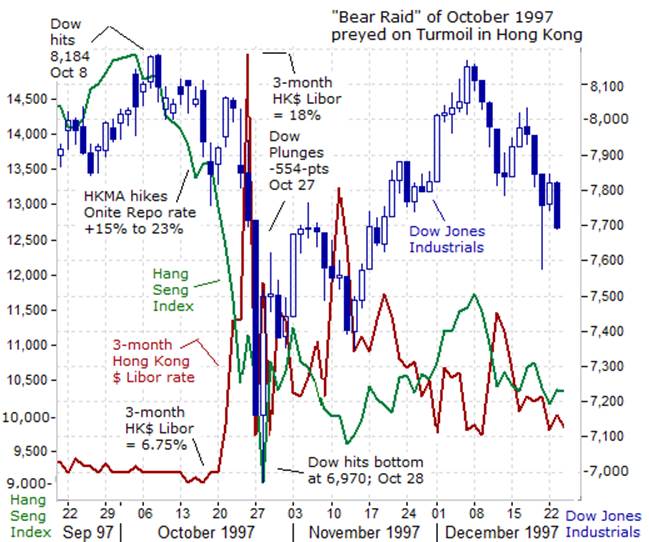
This was the structural dilemma inherent with defending a fixed currency exchange rate. The HKMA was forced to buy HK dollars from speculators, which in turn, shrank the Hong Kong money supply and drove HK$ short-term interest rates higher. Meanwhile Bear Raiders such as Hedge funds took naked short positions in the Hong Kong stock and futures markets, and earned heft profits, as the upwards spike HK$ interest rates caused jittery investors to dump their shares in the Hang Seng index. The Hang Seng index lost –one-third of its value in three weeks, and climaxing with a -14% loss on October 28th. Until then, however, Asia’s currency firestorm seemed largely contained within the region; the rest of the world had felt only the heat, not flames. However, the Asian financial crisis did push 1/3 of the global economies into recession in 1998.
Bear Raiders on Wall Street took note of the sharp slide in the Hang Seng index, and began shorting US-stock index futures. The Dow Industrials began to lose ground, tumbling -450-points in the first few weeks of October, and on Oct 27th, the Dow was pummeled -554-points, to close -7.2% lower at the 7,161-level, its largest daily decline ever in points (at that time in history). The Dow’s sell-off triggered two halts in trading under rules set up in the wake of the crash of 1987. The first halt came at 2:35-pm EST, which ended at 3:05-pm EST. The Dow promptly plunged -200-more points, triggering the second halt at 3:30-pm and closed the market, a half-hour prior to the normal 4-pm close. Earlier in the day, before the Dow’s late afternoon crash, market indexes from London to Frankfurt suffered their own sharp falls. London fell -2.6%, while Germany, France, and Italy all shed -2.8%. Among the smaller markets, Finland plunged -5.7%, while Spain skidded -4.1%.
The Nasdaq Composite index suffered big losses, ending -7% lower, or -115-points to close at 1,535. The S&P-500 index fell 64.63-points, or -6.9%, to end at 877.01. Several stock market analysts saw this crash as a healthy correction to cool the overheated markets, which had doubled in value in the previous 30-months. Volume also hit a record high. NYSE volume topped 695-million shares, outstripping the previous record of 684-million shares traded on January 23, 1997.
On Tuesday, October 28th 1997, -- the US-stock markets were widely expected to open lower, due to further sharp losses on the Asian markets. At the epicenter, in Hong Kong, the Hang Seng Index fell a staggering -14% in a single day, and Japan’s Nikkei fell -4.3%. The US-stock indexes initially continued their slide, the Dow fell as much as -186- points by 10:06-am, and then, -the Crash abruptly ended. The markets began to rebound soon thereafter. By 10:20-am, the Dow was only -25 points lower. Five minutes later, the Dow roared back into positive territory and was up +50 points. Nine minutes later at 10:34-am, the Dow rallied to a triple-digit advance up +134-points. NYSE prices continued to soar in choppy trading throughout the rest of the day. At the close of trading at 4:00 pm, the Dow finished with a stunning +334-point gain (recovering 61% of the previous day’s loss) to close at 7,498. The market restored $384-billion of the $663-billion in wealth that was lost the previous day. One billion shares were traded on the NYSE for the first time ever, with a volume of 1.21-billion shares.
The “miracle rally” of Oct 28th, 1997 signaled the beginning of the end of the Bear Raid. In typical fashion, the Dow’s -554-point Crash was followed by a V-shaped recovery rally that would restore all of the wealth of US-shareholders by Dec 5th, when the Dow reached a high of 8,166. Yet the culprit behind the Bear Raid of October 1997, - the Hang Seng index, - experienced a more muted rally from its October lows, and was left nursing a -30% loss from its Sept highs. Conspiracy theorists say the US-Treasury’s “Plunge Protection Team” <PPT> intervened on the morning of October 28th to put a floor under the US-markets, which in turn, caused the Bear Raiders to quickly scramble to cover their shorts. The footprints of the unraveling of the Bear Raid is the classic V-shaped recovery that recoups the losses sustained in a Crash. The Bearish narrative that was provided to the media, and that gave ammunition to the Bear Raiders and frightened the Bulls during the crash, was quietly swept under the rug.
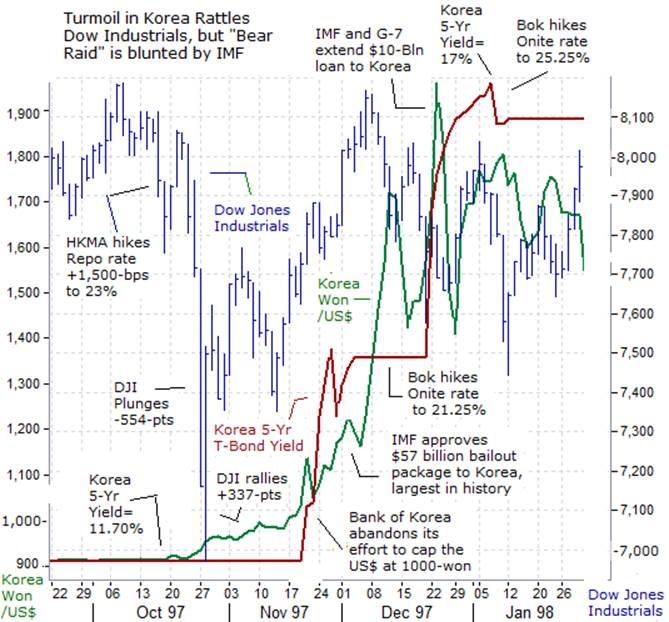
Dec 1997 - Currency Crisis in Korea, - Yet what was perceived to be a localized crisis in Thailand, Malaysia, Indonesia, the Philippines, and Hong Kong- would soon spread to South Korea, an Asian tiger. Currency speculators began to attack Korea’s won. On November 1st, the Bank of Korea <BoK> vowed it would “never” let the US$ rise above 1,000-Korean won, but on November 17th, the BoK stopped defending its currency, and the Korean won fell -10% in two days. On November 22nd, the Bank of Korea hiked its overnight call rate +1% higher to 14%, and Seoul asked the IMF for a Thai-style bailout. About $25-billion fled Korea during November, thereby depleting one-third of its foreign exchange reserves to $19.7-billion. In turn, currency traders quickly bid-up the US$ towards 1,200-Korean won.
In response, on December 3rd, the IMF and Group of Seven (G-7) offered a $58-billion package of loans and loan pledges to the Korean government. Despite news of this record bailout package, the Korean won still lost about half its value, as the US$ soared to as high as 1,950-won on Dec 22nd. The BoK was forced to hike its overnight loan rate to 21.25% to defend the won. Korean companies had $170-billion in foreign debt, and practically none of it was hedged. This meant that the collapse of the Korean won had nearly doubled the cost of servicing the foreign debts, virtually overnight, and if left unchecked, could’ve pushed many Korean companies to the brink of default.
From Sept 15th thru Dec 15th, 1997, the market value of Korea’s Kospi index had dropped in half. For US-based investors in Korea stocks, the pain was much worse, as the Korean won lost about half of its value against the US$. So on Dec 24th, the IMF and the G-7 rode to the rescue, by providing Seoul with the first tranche of $10-billion in loans from to forestall a default on its short-term loan debts. In reaction, the US$ quickly fell to as low as 1,425-won, before settling into a dangerously high range around 1,600-won. Bear Raiders tried to make some money from the turmoil in Korea, but couldn’t knock the Dow below the 7,500-level, and came nowhere close to the Oct Crash bottom low. In fact, the Dow would shake off the Korean crisis and climb to new heights at the 9,200-level by April 1998.
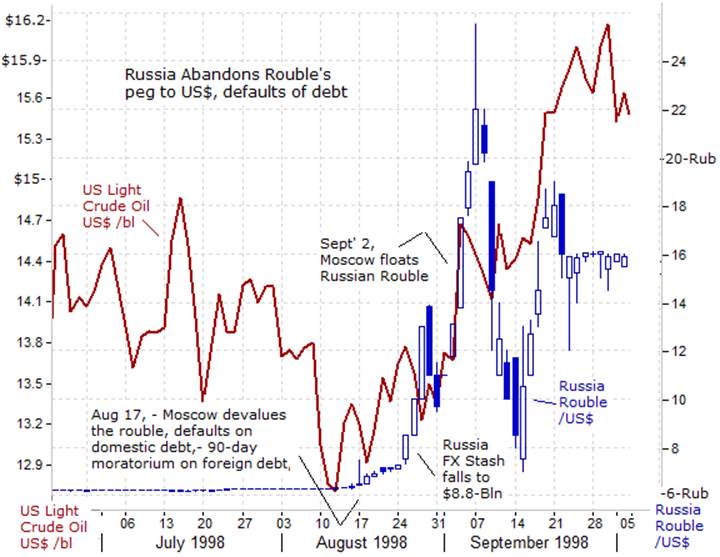
1998- Russia Currency and Debt Crisis, - One of the knock-on effects of the Asian financial crisis that began in April 1997, showed-up in long lasting declines in the price of crude oil and base metals that were, in turn, drying up the cash inflows into Russia’s foreign exchange reserves. From as high as $26.50 /barrel in Jan 1997, the price of crude oil fell in half, to as low as $11.60 /barrel in July 1998. Given Russia’s fragile economy, the sharp decline in the prices of crude oil and metals resulted in an economic chaos in the country. The inability of Moscow to implement a coherent set of economic reforms led to a severe erosion in investor confidence and a chain reaction that can be likened to a run on the Russian central bank. Investors fled the Russian market by dumping Russian bonds and stocks. In a vicious cycle, the selling put more downward pressure on the rouble.
After the breakdown of the Soviet Union, the Kremlin decided to peg the roubles’ exchange rate at 6.5-roubles /US$. This forced Moscow to spend $27-billion of its foreign reserves in the first half of 1998, in order to defend the rouble’s peg with the US$. By Sept 1998, Russia’s stash of foreign currency reserves had dwindled to just $8.8-billion. Oil producers were also feeling the pain. The crisis in Asia had caused a big slump in the demand for oil. The OPEC cartel of oil producers had to watch in disbelief when oil prices slipped below $13 per barrel in August 1998. Saudi Arabia, Venezuela and Mexico tried to shore up prices with production cuts, but the oil markets are not reacting positively. Instead, oil prices were scraping bottom, and making it impossible for Russia to balance its budget.
As a result, the Russian government became hooked on short-term loans to finance its budget deficit, which equaled 6% of gross domestic product. As investor confidence sank, the rouble’s peg to the US$ came under increasing stress. In April 1998, there was a consortium of Bear Raiders that unleashed a speculative attack on the rouble which forced the Russian central bank to spend an extra $1-billion of its dwindling stash of FX reserves. To fight off the speculators, on May 19, 1998, the Bank of Russia hiked its repo rate �bps to 50%. However, crude oil prices kept dropping and the central bank kept bleeding US dollars. Eight days later (May 27, 1998), Bank Rossi hiked the repo lending rate to 150% and in turn, the Russian stock market began to meltdown.
In July, 1998, the IMF approved a tranche of $11.2-billion in new loans, of which $4.8-billion was to be disbursed immediately. Yet between May and August, approximately $4-billion had left Russia in capital flight, and Russia lost around $4-billion in revenue due to sagging oil prices. After losing so much liquidity, the IMF assistance did not provide much relief.
On August 13th, 1998, the Russian bond and stock markets collapsed on fears that Moscow would soon abandon the rouble’s rigid peg to the US$, which was becoming too expensive to defend. Annual yields on ruble-denominated bonds exceeded 200%. August 17th, 1998, the Kremlin announced a devaluation of the rouble; the bounds of the corridor in which the rouble would be allowed to fluctuate was widened from <5.27-7.13> to <6.00-9.50> rouble to the US$; Moscow also declared a default on $30-billion of short-term Treasury Bills known as GKO’s, as well as longer-dated ruble denominated bonds named OFZ’s; It declared a 90-day moratorium on payments by commercial banks to foreign creditors. On September 2nd, 1998, The Russian Central Bank’s decided to remove the currency corridor and allowed the ruble to float more freely. In 3-days, the Russian rouble lost half of its value to the US$.
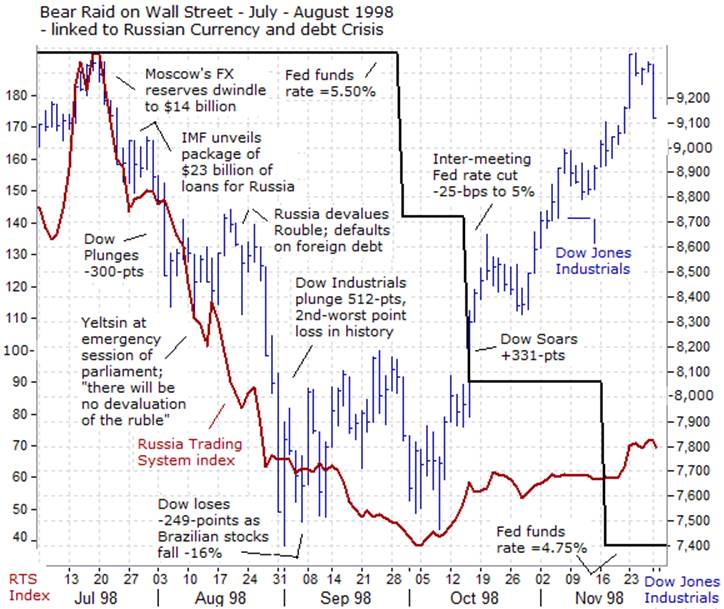
The collapse of the Russian Rouble triggered a horrific sequence of events; hyper-inflation, with Russian consumer prices rising at a 27.6% annualized clip in 1998, and +86%% in 1999. Because of soaring food prices, citizens demonstrated in the streets. On Nov 20th, 1998, the Russian Deputy Minister of Finance Mikhail Kasyanov declared the country would default on $61-billion worth of rouble-denominated public debt, (equaling 17% of Russian GDP), and could repay less than $10-billion of its $17-billion in foreign debt. Russian bank deposits decreased by -15%. From July 20th, 1998 thru October 5th, 1998, the Russian Trading System Index, lost -75% of its value. The Russian economy contracted by -5.3% in 1998. Per capita GDP slumped to its lowest since 1991.
Once again, the Bear Raiders on Wall Street seized upon turmoil in foreign markets, to short sell the Dow Jones Industrials, and spread the bearish narrative to the media, - explaining why the collapse of the Russian stock market should make US-investors nervous, and prod them to sell their US-listed stocks. The scheme was successful, - the Dow Industrials fell from as high as 9,250 on July 20th, 1998 to as low as 7,400 on Sept 1s, a decline of -20%, or to the border-line of an official Bear market. Stock market indexes in Canada, France, and Italy fall more than -28%.
However, the second half of this story has a familiar ending. The Greenspan Fed rides to the rescue of shareholders by exercising the “Greenspan Put,” with a series of three quarter-point rate cuts, including an unexpected “inter-meeting” rate cut on October 15th to 5% that completely caught the markets off guard, and sent the Dow Industrials soaring +350-points higher in the afternoon. The timely exercise of the Greenspan Put enabled the Dow Industrials to break through stiff overhead resistance at the 8,200-level, and the rally would add +1,000-points. On Nov 23rd, 1998, the Dow Industrials reached the 9,250-level, - the original starting point where the Russian Bear Raid began.
The Infamous May 2010 “Flash Crash – Dow plunges -1,000-points intra-day, On the 1-year anniversary of the “Least Loved” Bull market, the Dow Industrials closed at the 10,550-level, after climbing +4,000-points above the previous Bear market bottom low set on March 9th 2009. The Dow’s heroic rally would extend to the 10,900-level by the end of March 2010, as the Fed finished the last of its $1.75-trillion of liquidity injections through its QE-1 scheme. But lying dormant, under the radar screen, was the Greek debt crisis that was brewing just beneath the surface, and threatening to ignite the next global financial crisis--just as the world hoped it might be exiting from the last one.
Little Greece--whose economy is just 3% of Europe’s GDP--could, against its will, set off a chain reaction that pulls down Portugal, Ireland, Spain, perhaps even Italy, and thereby throws Europe’s, and then America’s and the rest of the world’s, fragile recoveries into reverse. Greece’s tiny bond market--barely a billion Euros a day trading, made it an easy and tempting target for traders with big bats; by attacking Greek bonds, “Bear Raiders” get to play the volatility in bond and currency rates, thereby leveraging a little nation’s problems into gigantic gains for short sellers.
On April 26th, 2010, the yield on 10-year Greek bonds rose to nearly 10%, and 2-year yields soared over +300-basis points (bps) on the day to briefly hit 14 percent. The gap between the 2-year Greek and German bond yields ballooned to +1,300 bps. Credit default swaps on Greece’ debt hit 641-bps, or $641,000 per year for five years to insure $10-million in debt, from 390-bps a week earlier. The question was whether Greece would be the next Lehman Brothers of sovereign credit. If it was forced into debt rescheduling and renegotiation, Greece could well spark a panicky stampede out of the Euro.
On April 27th, 2010, S&P downgraded Greece’s debt ratings a full three notches to BB-plus, the first level of junk, status, adding the outlook is negative, meaning the agency could downgrade the rating again. S&P said bondholders might only recover 30% to 50% of their investments if Athens failed to make debt payments. Europe’s most-indebted country relative to the size of its economy had about €296-billion worth of bonds outstanding. The downgrade to junk status led investors to dump Greece’s bonds, driving yields on two-year notes above 25% in London from 4.6% a month earlier.
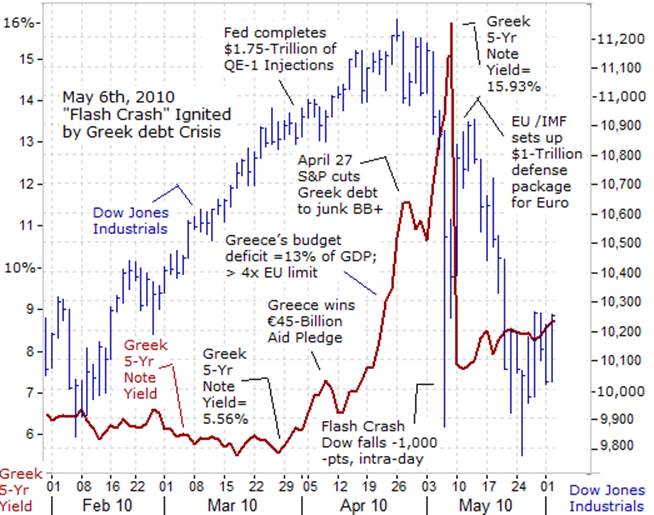
On May 4th, 2010 - A renewed selling frenzy gripped the Greek bond market as concern mounted that a €110-billion ($146-billion) aid package, wouldn’t be enough to prevent an eventual default. On the Athens Stock Exchange, Greece’s bank stock index, plunged -10%. Shares of National Bank <NBGr.AT>, the country's largest lender, fell -12.2%. Alpha Bank <ACBr.AT> ended -11.6% lower. Greek bank stocks were 27% year to date. As Greek yield spreads continued to widen out dramatically the contagion spread to other European banks, which held an estimated $272-billion in Greek public and private debt, with French, Swiss and German banks accounting for nearly 75% of the exposures.
On May 6, 2010, - the Dow Jones Industrial Average suffered its worst intra-day point loss in history, a stunning plunge of -1,000-points before recovering +650-points from the low of the day, in what is arguably the wildest day in Wall Street’s history. At the onset of the day, the yield on Greece’s 5-year note had soared to 16%, extending a surge of +5.5% in just two days. The upward spiral in Greek bond yields touched off a chain reaction of events on May 6th that would ignite the “Flash Crash.” At about 2:32 p.m. on May 6th, a Bear Raider began to sell $4.1-billion worth of E-Mini S&P-500 futures contracts, and over the next 20-minutes dumped 75,000-contracts onto the market, “without regard to price or time,” and even accelerated its selling as prices plunged. Normally, a sale of this size would take place over as many as five hours, but the large sale was executed in 20 minutes. The Dow Jones industrials plunged more than -600 points in a matter of minutes that day to an intra-day low of 9,870, and then recovered +650-points in a blink.
As is typical of a Crash, the hard fought gains of an 11-week rally were wiped out in less than 72-hours of furious selling. What is also typical was the exercise of the Bernanke “Put” option, in response to the volatility on Wall Street. On July 2nd, the Dow Jones industrials began to regain its footing at the 9,700-level. In late August, Fed chief Ben “Bubbles” Bernanke began to signal the launch of QE-2, which would add $600-billion of liquidity injections, used to inflate the US-capital markets. On October 18th, the Dow rebounded to the 11,100-level, recouping all of its losses from the Greek debt crisis.
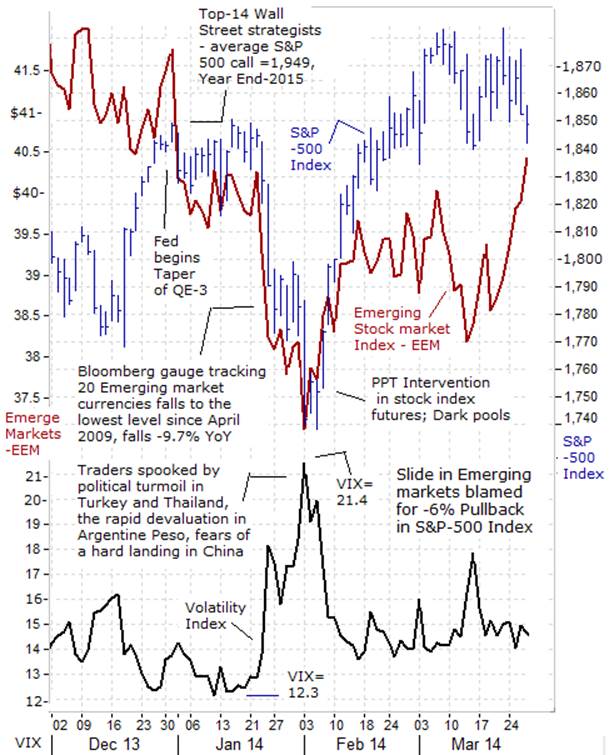
Traders saw this Bear Raid movie earlier this year, although with different actors. In the second half of January ’14, there was a Bear Raid that was ignited by unexpected events. From Jan 23rd thru Feb 5th, the S&P-500 swiftly fell -7% in eight trading days, to as low as the 1,740-level. Fueling the mini panic were sharp declines in the exchange rates of major Emerging currencies, which in turn, were triggering a flight of capital from Emerging bond and stock markets. In hindsight, the slide in Emerging market stocks, <NYSE; EEM>, was a convenient excuse to launch a Bear Raid on Wall Street.
Traders bought cheap insurance against a possible decline in the S&P-500 index. They bid up the Volatility Index (ie; VIX) from as low as 12.3 to as high as 21.4 on Feb 3rd. However, the Bear Raid didn’t last long. The PPT engineered a vicious short squeeze rally, and in typical V-shaped fashion, the S&P-500 index rebounded strongly. Within just seven trading days, the S&P had recouped its -7% loss from the Bear Raid, and extended its gains to new all-time highs above the 2,000-level.
There are dozens of examples of Bear Raids in the US-stock markets, and even more impressive ones in foreign stock markets. However in the US-stock market, the rules of the game are rigged by the “plunge protection team” <PPT>, which monitors the markets 24-hours per day, across all time zones. As has been the case for the past few decades, Bear Raiders in the US-stock market must cover their shorts within a few days or weeks, after the panic selloff has been achieved. While there were many successful Bear Raids, at the end of the day, the US-government authorities have been able to overcome every major market setback and have guided the equity markets to new all-time highs.
In other words, today’s investors in the US-stock market can sleep soundly at night, knowing that their bets in the US-stock market are under the protection of the “Yellen Put” option, which is an insurance policy that guarantees the Fed will always ride to the rescue of the Dow Industrials, and squash the designs of the Bear Raiders, through the power of its electronic printing press.
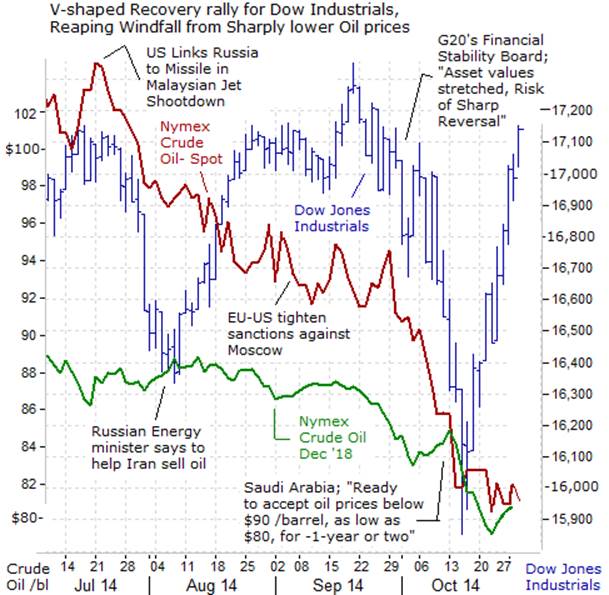
Most recently, the Bear Raiders engineered a -1,400-point drop in the Dow Industrials, from Sept 18th thru the early hours of October 16th, 2014. Bearish short sellers pointed to a -15% decline in the German stock market, the partial unwinding of the yen carry trade, and a -12% correction in the Russell micro-caps to convince the Bulls to liquidate some of their positions. But the PPT was quick to the rescue, putting a floor under the Dow at the 16,000-level, with verbal jawboning tactics, and more.
With PPT intervention signaling a bottom for the market, the Bear Raiders turn into raging Bulls. Suddenly, the narrative in the financial media began to shift, and the focus was spotlighted on reasons to be Bullish, such as the -20% slide in crude oil prices to around $82 /barrel, as a net positive event for US-businesses and consumers. Tracking this into gasoline prices, the average US-household would receive a gasoline tax rebate of about $600 per year. In classic fashion, the Bear Raid is soon followed by V-shaped recovery rally to the previous highs, or higher. A few weeks of panic is followed by a few weeks of greed, and the Dow Industrials index returns to the place where the Bear Raid began. So don’t be hoodwinked in the future. Bear Raids occur about three times per year on average, and now you know how to spot them and how to deal with them.
This article is just the Tip of the Iceberg of what’s available in the Global Money Trends newsletter. Global Money Trends filters important news and information into (1) bullet-point, easy to understand reports, (2) featuring “Inter-Market Technical Analysis,” with lots of charts displaying the dynamic inter-relationships between foreign currencies, commodities, interest rates, and the stock markets from a dozen key countries around the world, (3) charts of key economic statistics of foreign countries that move markets.
Subscribers can also listen to bi-weekly Audio Broadcasts, posted Monday and Wednesday evenings, with the latest news and analysis on global markets. To order a subscription to Global Money Trends, click on the hyperlink below,
http://www.sirchartsalot.com/newsletters.php
or call 561-391- 8008, to order, Sunday thru Thursday, 9-am to 9-pm EST, and on Friday 9-am to 5-pm.
This article may be re-printed on other internet sites for public viewing, with links to:
http://www.sirchartsalot.com/newsletters.php
Copyright © 2005-2014 SirChartsAlot, Inc. All rights reserved.
Disclaimer: SirChartsAlot.com's analysis and insights are based upon data gathered by it from various sources believed to be reliable, complete and accurate. However, no guarantee is made by SirChartsAlot.com as to the reliability, completeness and accuracy of the data so analyzed. SirChartsAlot.com is in the business of gathering information, analyzing it and disseminating the analysis for informational and educational purposes only. SirChartsAlot.com attempts to analyze trends, not make recommendations. All statements and expressions are the opinion of SirChartsAlot.com and are not meant to be investment advice or solicitation or recommendation to establish market positions. Our opinions are subject to change without notice. SirChartsAlot.com strongly advises readers to conduct thorough research relevant to decisions and verify facts from various independent sources.
Gary Dorsch Archive |
© 2005-2022 http://www.MarketOracle.co.uk - The Market Oracle is a FREE Daily Financial Markets Analysis & Forecasting online publication.