


How High Could USD/JPY Go?
Currencies / Japanese Yen Nov 18, 2014 - 05:55 PM GMTBy: Nadia_Simmons

 Yesterday, official data showed that annualized Japan's gross domestic product dropped by 1.6% in the third quarter, missing economists‘ forecast of a 2.3% growth and following a 7.3% drop in the second quarter, which puts the country in a recession. In these circumstances USD/JPY extended gains and hit a fresh multi-year high of 117.04. How high could the exchange rate go?
In our opinion, the following forex trading positions are justified - summary:
EUR/USD: none
GBP/USD: none
USD/JPY: none
USD/CAD: none
USD/CHF: none
AUD/USD: none
EUR/USD
The medium-term picture of EUR/USD hasn't changed much as the exchange rate is still trading around the 127.2% Fibonacci extension. Will the daily chart show us where will the pair head next?
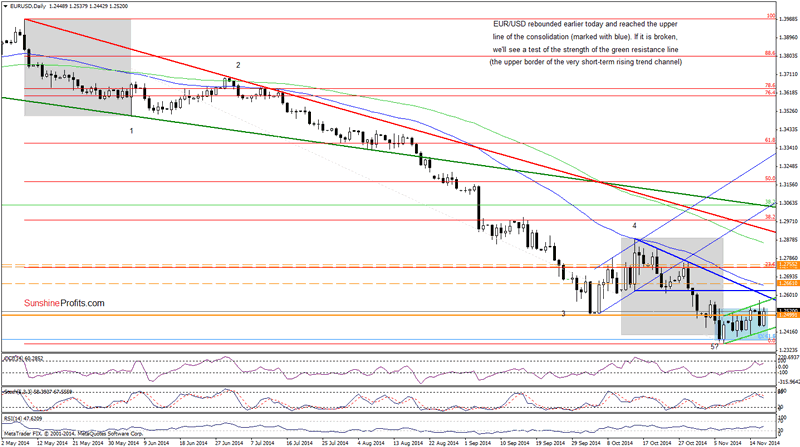
From this perspective, we see that EUR/USD reversed and rebounded earlier today. With this upswing, the exchange rate came back above the level of 1.2500 once again and reached the upper line of the consolidation (marked with blue). This is the place, where we should consider two scenarios. On one hand, if currency bulls push the pair higher, we'll see an increase to the upper line of the very short-term rising trend channel (around 1.2564) or even to the blue resistance line based on the Oct 15, Oct 21 and Oct 29 highs (currently around 1.2600). On the other hand, if this area stops further improvement, we'll see a drop to the green support line based on the recent lows (currently around 1.2417) or even to the lower border of the consolidation (around 1.2364) in the coming days. Which scenario is more likely? Taking into account a sell signal generated by the Stochastic Oscillator and the proximity to resistance lines, it seems that currency bears have a small advantage over opponents, which suggests another drop below 1.2500.
Very short-term outlook: mixed
Short-term outlook: mixed
MT outlook: mixed
LT outlook: bearish
Trading position (short-term): In our opinion no positions are justified from the risk/reward perspective at the moment.
USD/JPY
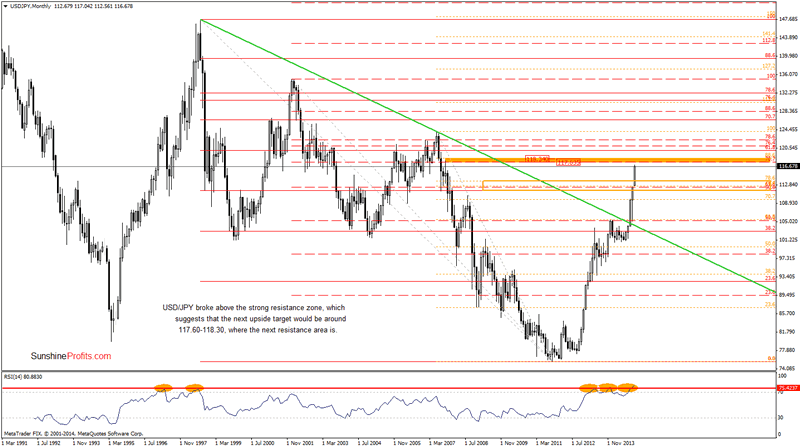
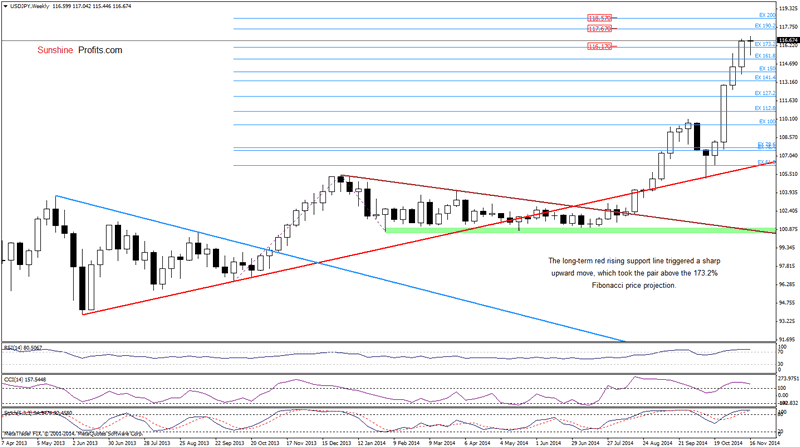
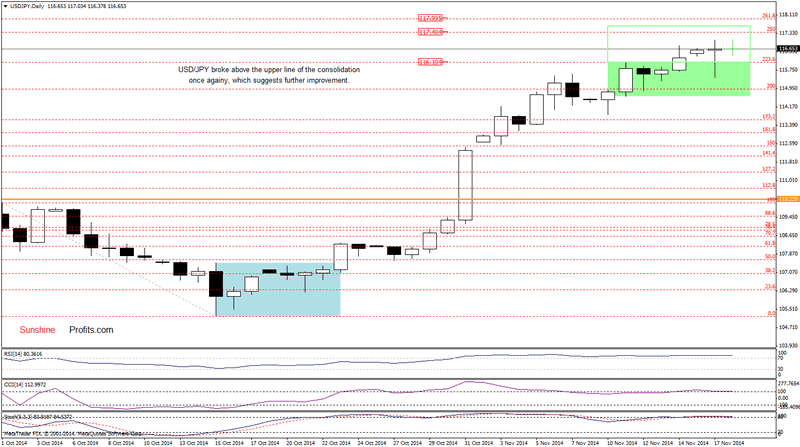
Looking at the above charts, we see that currency bulls pushed the pair higher once again and USD/JPY hit a fresh multi-year high of 117.04. As you see on the daily chart, the exchange rate is still trading above the previously-broken upper line of the consolidation (marked with green), which suggests further improvement. Taking these facts into account, what we wrote on Friday is up-to-date:
(...) the initial upside target would be the 250% Fibonacci extension at 117.40 or even the solid resistance zone (marked on the monthly chart) around 117.60-118.57. Nevertheless, we should keep in mind that there are negative divergences between the CCI, Stochastic Oscillator and the exchange rate, while the monthly RSI climbed to its highest level since Dec 2013, which suggests that a pause is just around the corner.
Very short-term outlook: bullish
Short-term outlook: mixed with bullish bias
MT outlook: bullish
LT outlook: bullish
Trading position (short-term): In our opinion no positions are justified from the risk/reward perspective at the moment.
USD/CAD
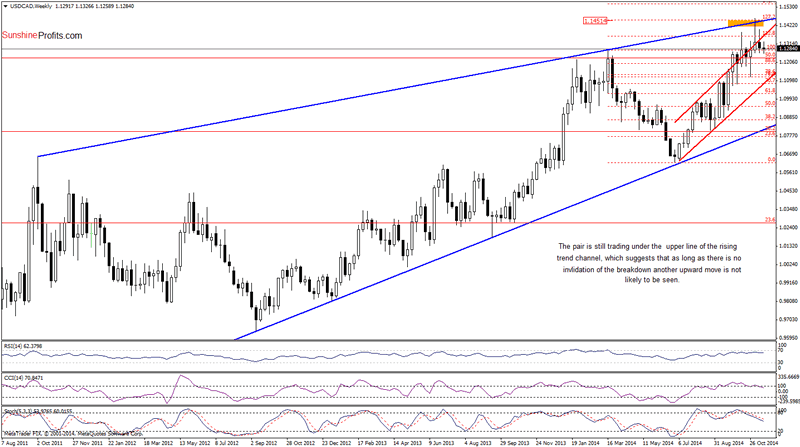
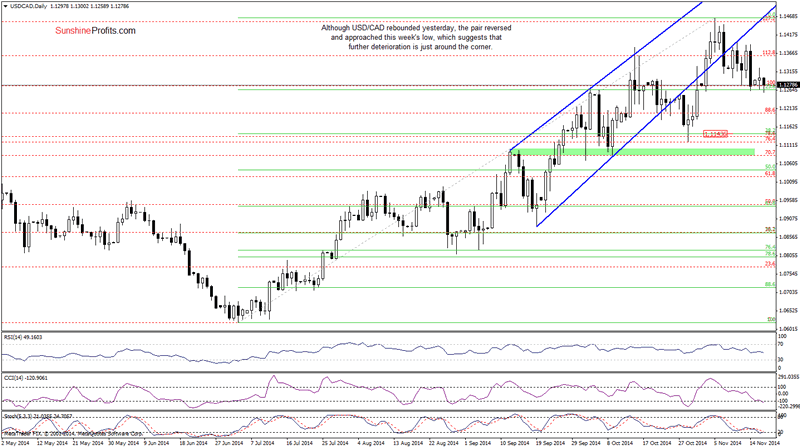
From the medium-term perspective, we see that the strong resistance zone created by the upper line of the rising trend channel (marked on the weekly chart) and the 127.2% Fibonacci extension still holds. Therefore, although USD/CAD moved little higher yesterday, the pair reversed and decline today, approaching the 23.6% Fibonacci retracement (based on the entire Jul-Nov rally) and the last week's low. Taking all the above into account, we think that if the exchange rate drops below these levels, we'll see further deterioration and the next downside target would be around 1.1142, where the 38.2% Fibonacci retracement is.
Very short-term outlook: mixed with bearish bias
Short-term outlook: mixed with bearish bias
MT outlook: mixed with bearish bias
LT outlook: bearish
Trading position (short-term): In our opinion no positions are justified from the risk/reward perspective at the moment.
Thank you.
Nadia Simmons
Forex & Oil Trading Strategist
Przemyslaw Radomski
Founder, Editor-in-chief
Gold & Silver Trading Alerts
Forex Trading Alerts
Oil Investment Updates
Oil Trading Alerts
* * * * *
Disclaimer
All essays, research and information found above represent analyses and opinions of Nadia Simmons and Sunshine Profits' associates only. As such, it may prove wrong and be a subject to change without notice. Opinions and analyses were based on data available to authors of respective essays at the time of writing. Although the information provided above is based on careful research and sources that are believed to be accurate, Nadia Simmons and his associates do not guarantee the accuracy or thoroughness of the data or information reported. The opinions published above are neither an offer nor a recommendation to purchase or sell any securities. Nadia Simmons is not a Registered Securities Advisor. By reading Nadia Simmons’ reports you fully agree that he will not be held responsible or liable for any decisions you make regarding any information provided in these reports. Investing, trading and speculation in any financial markets may involve high risk of loss. Nadia Simmons, Sunshine Profits' employees and affiliates as well as members of their families may have a short or long position in any securities, including those mentioned in any of the reports or essays, and may make additional purchases and/or sales of those securities without notice.
© 2005-2022 http://www.MarketOracle.co.uk - The Market Oracle is a FREE Daily Financial Markets Analysis & Forecasting online publication.