


U.S. Economy is in a Sweet Spot!
Stock-Markets / Financial Markets 2014 Dec 19, 2014 - 03:16 PM GMTBy: Puru_Saxena

 BIG PICTURE - The world's prominent central banks are pursuing an accommodative monetary policy and this bodes well for the stock market. Remember, when it comes to investing, monetary policy trumps everything else and the risk free rate of return determines the value of every asset. When interest rates are low and credit is cheap and plentiful, asset prices tend to inflate. Conversely, when interest rates are high and credit is tight, asset prices tend to deflate.
At present, the world's largest economy is healing and its central bank is maintaining the Fed Funds Rate at a historic low. After several years of deleveraging, American households are borrowing again (Figure 1) and this is stimulating business activity. Although the US unemployment rate has fallen significantly over the past year, inflationary pressures are well contained and this implies that the Federal Reserve will not raise interest rates anytime soon.
If our assessment is correct, the US economy is currently in a sweet spot (just enough growth and lack of inflationary pressures) and if its housing market continues to appreciate, it will unleash tremendous pent-up demand. After all, American households have deleveraged for several years and by doing so, they have postponed the purchase of big ticket items. However, it appears as though they are now beginning to open up their wallets again and this shift in sentiment is benefiting the cyclical industries. For instance, it was recently reported that America's auto sales have now jumped to levels not seen since 2003! In addition to buying new vehicles, Americans are refurbishing their homes, upgrading their properties, travelling more and spending more money on discretionary items.
Figure 1: US Households are borrowing again!
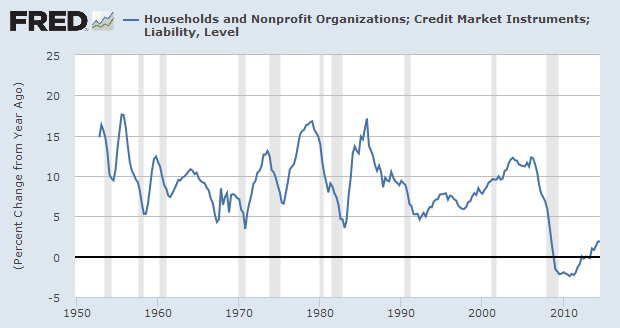
Source: St. Louis Fed
This shift in sentiment and perception is very bullish for business activity and over the following 2-3 years, it is probable that credit growth in the US will accelerate. If that happens, it will bring about an unprecedented economic boom which will not only benefit the US but the entire world economy.
Make no mistake, when Americans consume more, it will benefit many producing/exporting nations in the developing world and also help European exporters. So, the ongoing economic recovery in the US can only be positive for global growth.
Over in Europe, the situation is still unsatisfactory but even here; we believe that the continent has already passed the point of no return. If anything, we suspect that the European economic recovery is still in its infancy and additional monetary 'stimulus' from the European Central Bank (ECB) should bring about a shift in sentiment.
In any event, the ECB has already stated that it wants higher inflation in the Eurozone and it has recently started purchasing assets. Although anything can happen, we believe that if needed, the ECB will commence a full-scale QE program of buying sovereign bonds.
Over in Asia, the Bank of Japan (BOJ) is aggressively easing and the recent negative GDP-print will only bring about more 'stimulus'. Although additional easing may not benefit the real economy, it will certainly devalue the Japanese Yen and boost the stock market.
If you review Figure 2, you will observe that over the past year, the Japanese currency has depreciated significantly against the US Dollar. At present, the Japanese Yen is trading beneath the key moving averages and it appears as though the path of least resistance remains down.
Figure 2: Japanese Yen - heading south?
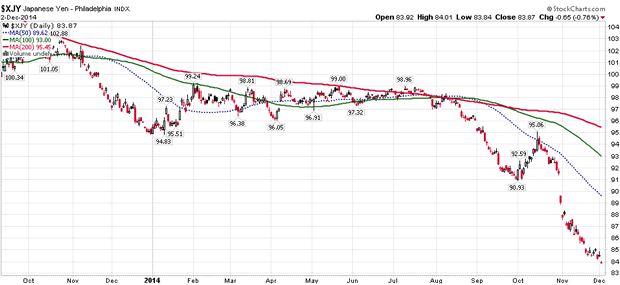
Source: www.stockcharts.com
Elsewhere in Asia, the Chinese authorities have recently cut interest rates; consequently, the Shanghai Composite Index has staged an impressive rally! Furthermore, it is rumoured that the People's Bank of China (PBOC) may also unveil a cut in the banks' minimum reserve requirements, so this may provide more fuel to the raging fire!
It is notable that unlike the other stock markets, Chinese equities have been in a relentless downtrend for 7 years, which is a very long time for any bear market. Moreover, due to the lengthy bear market, Chinese stocks are currently trading at depressed valuations; so the stage is now set for a powerful primary bull market.
Veteran investors may recall that before the bust in late 2007, the Shanghai Composite Index appreciated by approximately 600% in just over 2 years! So, given this history, it is conceivable that after a 7-year bear market, we may get an epic primary uptrend.
If you review Figure 3, you will note that after a huge consolidation phase, the Shanghai Composite Index has just broken out to a multi-year high. Although nothing is set in stone, these sorts of breakouts from lengthy base formations are usually followed by powerful moves and it appears as though the bear market low is now in the rear view mirror.
Bearing in mind the above, we have recently allocated some capital to China's A-shares and it is our belief that this position will provide good returns over the following year.
Look. There can be no doubt that China's housing market remains grossly overvalued and undoubtedly, mean reversion will occur at some point in the future. However, in the meantime, if the Chinese authorities embark on a massive easing program, then it is probable that the housing bubble will get even bigger! More importantly, monetary easing will surely have a positive impact on China's stock market.
Figure 3: Shanghai Composite Index (daily chart)
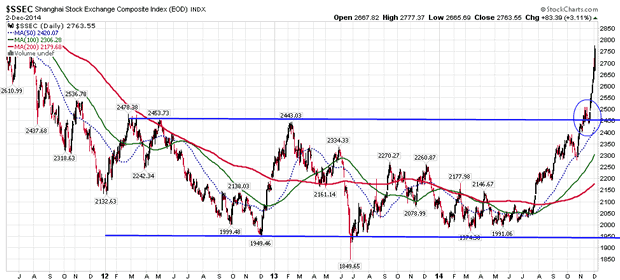
Source: www.stockcharts.com
Looking back at Wall Street, it is noteworthy that the major indices have climbed to all-time highs and this is good news for global equities. Remember, Wall Street is the most influential stock market in the entire world and its primary trend sets the tone for the other regions.
In terms of technical data, we are pleased to report that all the major data points that we monitor are aligned in a bullish manner and even the NYSE Advance/Decline Line has recently climbed to a new high; implying that the stock market breadth remains strong. Historically, the NYSE Advance/Decline Line has always peaked several months before the end of the bull market so this recent strength bodes well for the primary uptrend in common stocks.
As far as the favourable sectors are concerned, it is interesting to note that the cyclical sectors are performing well and doing better than the broad market. For instance, airlines, asset managers, auto dealers and parts manufacturers, credit cards, home builders, home improvement retailers, industrials, railways, restaurants, retailers and travel related counters are showing impressive strength! Elsewhere, biotechnology, consumer staples and healthcare stocks are also showing strength and we recommend exposure to these industry groups.
Conversely, energy, materials and precious metals stocks are underperforming the broad market by a wide margin and until the trend reverses, they should be avoided.
In the context of the broad stock market, you will recall that we had recently highlighted the weakness in the small-cap counters and the growth stocks. Despite the fact that the major indices were climbing to new highs, the growth stocks were not confirming the bull-run and this was an area of concern.
If you review Figure 4, you will note that the Russell 2000 Growth Index had fallen sharply during autumn and it had briefly dipped below its spring low. Fortunately, this index has staged an impressive rebound and it is now sitting comfortably above the key moving averages; thereby opening up the possibility of additional gains.
If the ongoing primary uptrend is strong and sustainable, then over the following weeks, the Russell 2000 Growth Index must appreciate further and take out its spring high. If that happens, new life will be injected into the stock market and the last bearish divergence will also disappear. So, this is one area we will continue to monitor closely.
Figure 4: Russell 2000 Growth Index (daily chart)
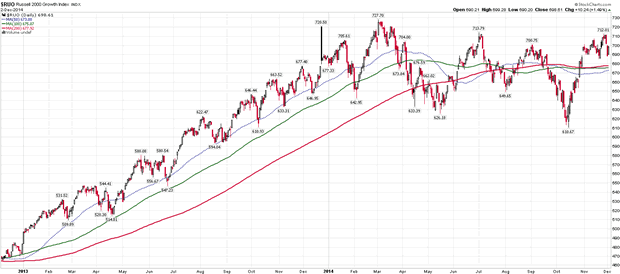
Source: www.stockcharts.com
Bearing in mind the above, we have allocated our equity portfolio to some of the leading stocks in the strong sectors and this strategy is well positioned to profit from the primary uptrend.
Looking at geographical exposure, we continue to overweight and recommend the developed world (Europe, Japan and the US); although we also see potential in China's and India's stock markets. Accordingly, we have invested our fund portfolio in our preferred investment themes (geographical areas and sectors).
PRECIOUS METALS - Whether you like it or not, precious metals are in a multi-year bear market and the path of least resistance remains down.
You will recall that the prices of both gold and silver peaked in 2011 and over the past 3½ years, they have drifted lower. For sure, the southbound journey has been punctuated by consolidations and the periodic relief rallies, but the primary trend has been down.
From a fundamental perspective, the macro-economic environment (recovery in the West and low inflation) is no longer conducive towards the metals and the strengthening US Dollar is an additional problem for the gold bugs. Similar to commodities, precious metals are also denominated in US Dollars and they are inversely correlated to the price fluctuations in the greenback. So, if the US Dollar continues to appreciate over the following months, then it is conceivable that the prices of precious metals will weaken further.
If you review Figure 5, you will note that during autumn, the price of gold sliced through last summer's low and by doing so, it reasserted its primary downtrend. Recently, the price of gold has firmed a bit but we suspect this is a counter-trend rally which will soon fizzle out.
Figure 5: Gold (weekly chart)
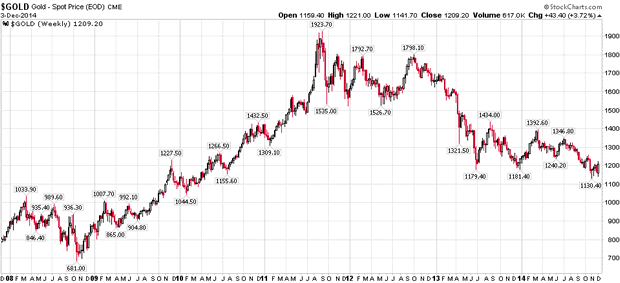
Source: www.stockcharts.com
Turning to silver, it is noteworthy that its price has also sliced through last summer's low and it is still trading beneath that level. Although the price of silver has already fallen significantly from the bull market top of US$50 per ounce, we suspect that the white metal will eventually trade below US$10 per ounce. After all, silver is merely a high-beta play on gold and the ongoing bear market in the yellow metal should weigh heavily on this volatile beast.
If our assessment proves to be correct, then the mining industry will have to endure a chilling, deflationary winter which will bring about the bankruptcy of many junior outfits. Already, the Gold Bugs Index has fallen to a 6-year low and additional strength in the US Dollar will probably bring about another smash.
Bearing in mind the above prognosis, we currently have no exposure to the physical metals or the related mining stocks. The trend in the precious metals remains down and our readers are advised to stay out of harm's way.
Puru Saxena publishes Money Matters, a monthly economic report, which highlights extraordinary investment opportunities in all major markets. In addition to the monthly report, subscribers also receive “Weekly Updates” covering the recent market action. Money Matters is available by subscription from www.purusaxena.com.
Puru Saxena
Website – www.purusaxena.com
Puru Saxena is the founder of Puru Saxena Wealth Management, his Hong Kong based firm which manages investment portfolios for individuals and corporate clients. He is a highly showcased investment manager and a regular guest on CNN, BBC World, CNBC, Bloomberg, NDTV and various radio programs.
Copyright © 2005-2014 Puru Saxena Limited. All rights reserved.
Disclaimer: The above is a matter of opinion provided for general information purposes only and is not intended as investment advice. Information and analysis above are derived from sources and utilising methods believed to be reliable, but we cannot accept responsibility for any losses you may incur as a result of this analysis. Individuals should consult with their personal financial advisors.© 2005-2022 http://www.MarketOracle.co.uk - The Market Oracle is a FREE Daily Financial Markets Analysis & Forecasting online publication.