


What Are Technical Indicators Saying About the Stock Market?
Stock-Markets / Stock Markets 2014 Dec 20, 2014 - 06:54 PM GMTBy: Sy_Harding

 It was just a week ago that financial headlines bemoaned the market having suffered its worst week in 2 ½ years. The bears came out of hiding with scary forecasts. Plunging oil prices, previously thought to be a positive for global economies, were suddenly seen as a major negative, along with the collapse of Russia’s economy and currency. Warnings of a potential global meltdown, perhaps even a 1998 style mini-crash, grew in number.
Bullish investor sentiment and confidence plunged. The weekly poll of its members by the American Association of Individual investors (AAII) fell to only 38.7% bullish.
The VIX Index, aka the Fear Index, spiked up into its fear zone again.
However, here we are just a week later, with the financial headlines celebrating the market’s biggest two-day gain in years (709 points by the Dow). Back is confidence of new highs for the year, and rising forecasts for 2015.
Yet, oil is still under $60 a barrel, and Russia’s problems have certainly not gone away.
It’s being said the rally is due to the Fed leaving language in its FOMC statement assuring it will be “patient” in deciding when to begin raising interest rates. That is not a change, since markets were not expecting the Fed to act before next summer anyway.
It is difficult to determine market direction by analyzing surrounding conditions, even those as dramatic as the collapse of oil prices, or guessing what the Fed might be planning.
So, let’s take a look at whether charts, technical indicators, and those watching them, may have had a bigger influence on the market’s recent volatility.
Readers of this column may recall that I warned several times that the market indexes had become unusually overbought above 50-day moving averages, the short-term indicators had triggered sell signals, and a short-term pullback of 4 to 5% was likely.
So far, that is all that happened.
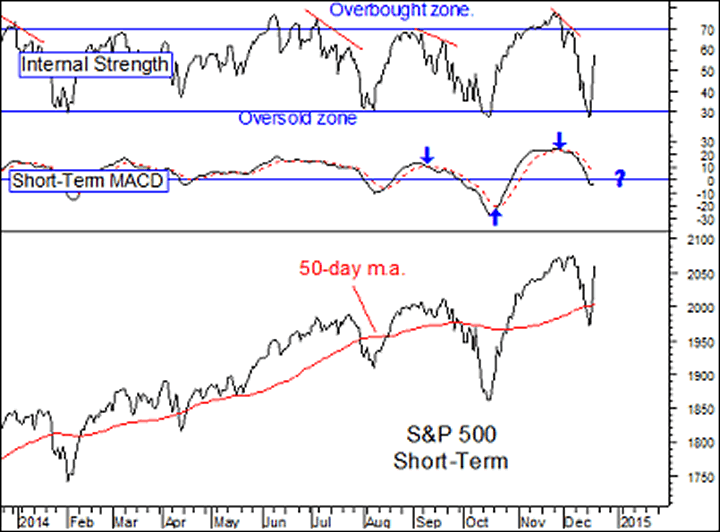
In the pullback, the Internal Strength indicator reached its oversold zone. The indexes typically overshot their 50-day moving averages. And the market bounced back after only a 5% decline by the S&P 500 (and other major indexes).
At this point, we cannot be sure the upside has resumed for the longer-term. Some of the short-term indicators have not turned positive yet.
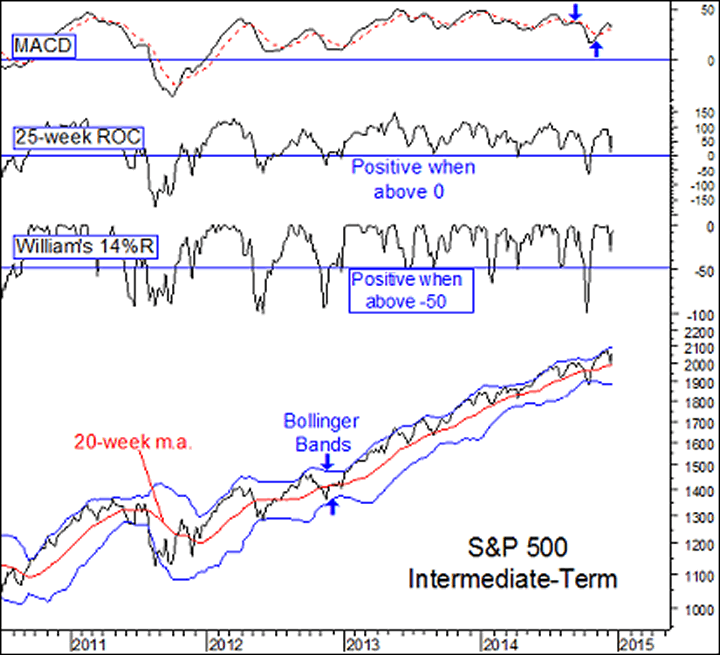
But let’s zoom out and look at an intermediate-term chart and a few intermediate-term indicators. They triggered a sell signal in September 1, and we expected a 15% to 20% correction to a low in October or November before the market’s favorable season would begin.
However, it was only an 8% pullback before the indicators returned to a buy signal, and the S&P 500 rallied back into the usually bullish upper half of Bollinger Bands.
The decline last week took the S&P 500 down enough to test the support at its 20-week m.a. and it bounced off it this week, keeping it still in the bullish upper half of Bollinger Bands.
So, technical analysis is saying the bull market continues, that last week’s ‘worst week in years’ was probably only the result of the market needing to have its short-term overbought condition alleviated (and investor euphoria cooled off).
This week’s bounce back keeps intermediate-term indicators on buy signals, and support levels intact.
Not that concerns about oil prices, Russia and other global problems are unimportant, or can be ignored. But I suspect that the charts and technical indicators will be just as important in identifying changes in money flow and momentum reversals in the market, short and intermediate-term, as the endless debates over surrounding conditions and the Fed’s intentions.
And for now anyway, technical analysis is saying the bull market is intact.
Sy Harding is president of Asset Management Research Corp., and editor of the free market blog Street Smart Post.
© 2014 Copyright Sy Harding- All Rights Reserved
Disclaimer: The above is a matter of opinion provided for general information purposes only and is not intended as investment advice. Information and analysis above are derived from sources and utilising methods believed to be reliable, but we cannot accept responsibility for any losses you may incur as a result of this analysis. Individuals should consult with their personal financial advisors.
Sy Harding Archive |
© 2005-2022 http://www.MarketOracle.co.uk - The Market Oracle is a FREE Daily Financial Markets Analysis & Forecasting online publication.