


Is the Gold Price Rally Over?
Commodities / Gold and Silver 2015 Jan 26, 2015 - 08:53 PM GMTBy: P_Radomski_CFA

 Briefly: In our opinion speculative short positions (half) are currently justified from the risk/reward perspective.
Gold’s rally took place along with the U.S. dollar’s rally and this was encouraging for gold bulls, but gold’s reaction after the 1,140 billion euro QE program was announced was very disappointing. Is the rally over and will the gold market plunge once again?
In short, it’s possible, but not imminent. Let’s move right to the charts (charts courtesy of http://stockcharts.com).
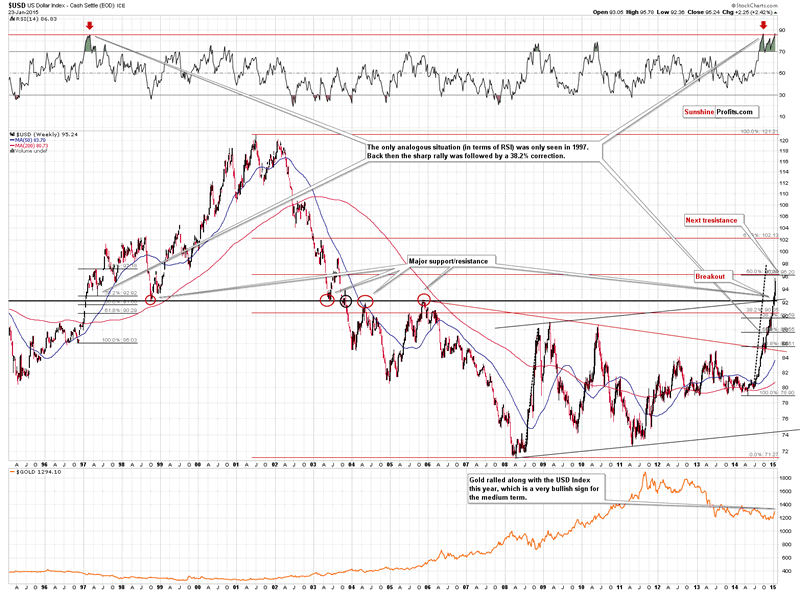
Our previous comments on the USD Index and its link to gold remain up-to-date:
The USD Index rallied just like we’d been expecting it to. The breakout above the 2005 high was confirmed so the next move was likely to be to the upside and we didn’t need to wait long to see one. The USD Index soared as the euro declined on the QE news. The interesting thing about this rally is that it’s likely not over, as no resistance level was reached yesterday and the next significant resistance is above 96. That’s where we expect the USD Index to stop for longer or perhaps where this rally would end. The former seems more likely at this time.
Why didn’t gold decline despite a move higher in the USD Index? Because it was not the inherent strength of the U.S. dollar that caused the move – it was the weakness of the euro (let’s keep in mind that the USD Index is a weighted average of various USD-linked currency rates and the EURUSD pair has the weight of over 50%). Investors were getting out of the euro and some of them were buying U.S. dollars and some of them were buying gold – hence both assets went up.
Now, the USD Index moved much higher yesterday, but gold didn’t move much, which could mean that gold actually did not show strength by holding up well in spite of the USD’s rally, but that it showed weakness by not rallying more given the declining value of the euro.
Overall, we think the implications for gold are bearish at this time for the short term. Naturally, the European QE is a bullish piece of news for gold in the medium- and long term.
Please note that gold declined in today’s pre-market trading without a rally in the USD Index (in fact, the USD declined slightly).
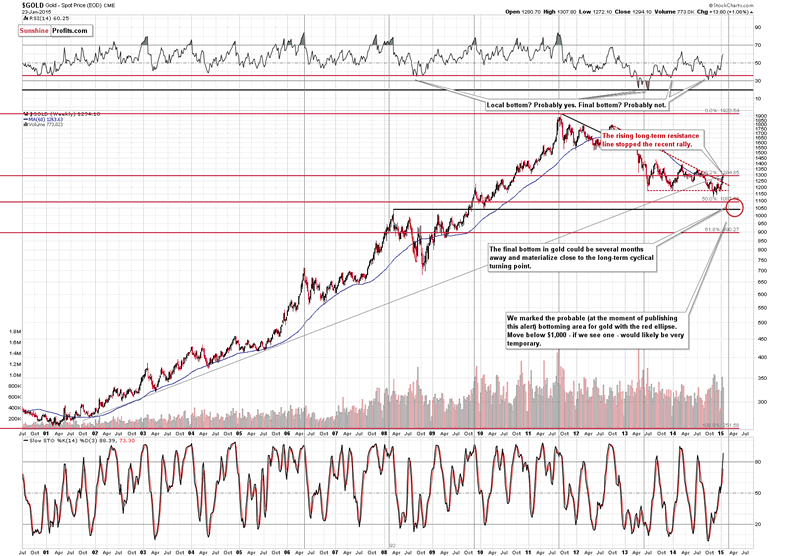
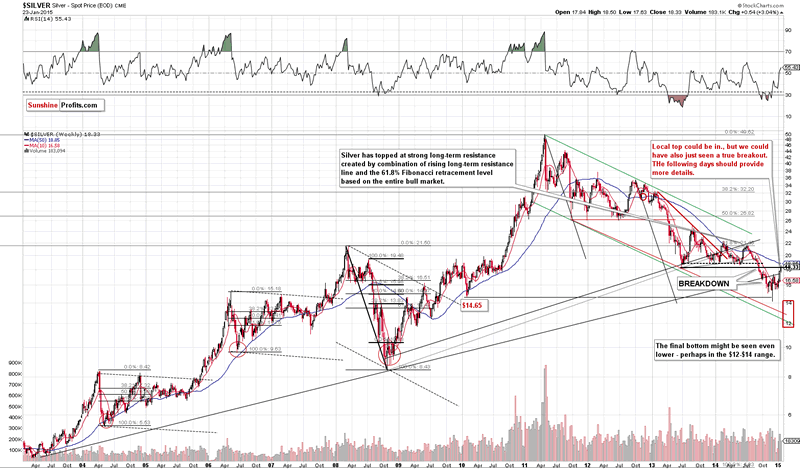
On the long-term chart we can see what we’ve already written above – that gold moved just a little higher. Gold just got an excellent trigger to move higher – above the long-term resistance line – and it didn’t work. Gold didn’t break out. We view it as a bearish sign.
Gold indeed declined after the bearish sign and it could be on its way to form the final bottom close to the long-term cyclical turning point.
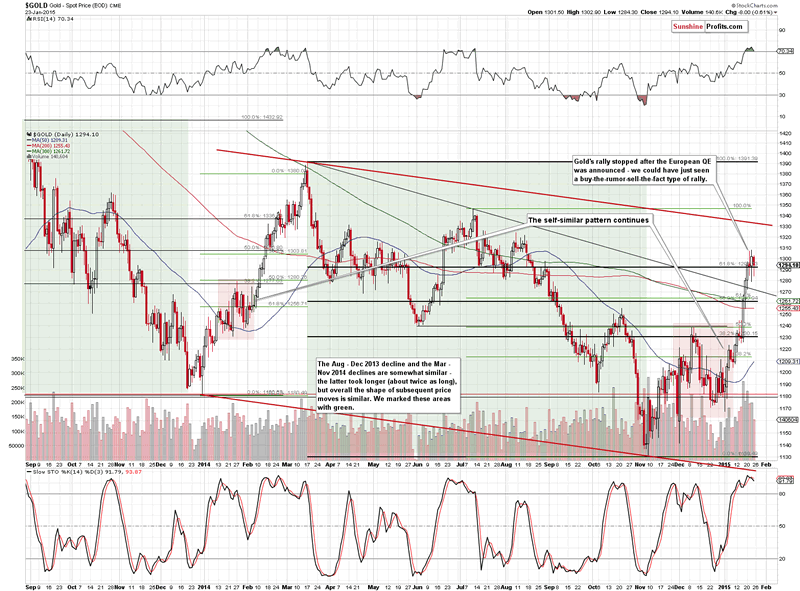
Our previous comments remain mostly up-to-date:
We finally saw some strength in gold, which might seem encouraging until you recall what caused the move. The move was “supposed to” be bigger given the announcement. The size of the move is something that looks like it’s about to be erased and the breakout seems likely to be invalidated. At this time we think that 2 additional daily closes would be required above the 61.8% Fibonacci retracement until we can say that the breakout is confirmed and that higher prices are likely.
Gold is already lower and back below the 61.8% Fibonacci retracement. The invalidation is a bearish signal on its own and is quite likely to lead to further declines. The short positions in the precious metals sector that we opened based on Thursday’s closing prices (gold closed at $1,302 on Thursday; the alert was sent/posted before the markets opened on Friday) are already profitable.
Will gold fall further?
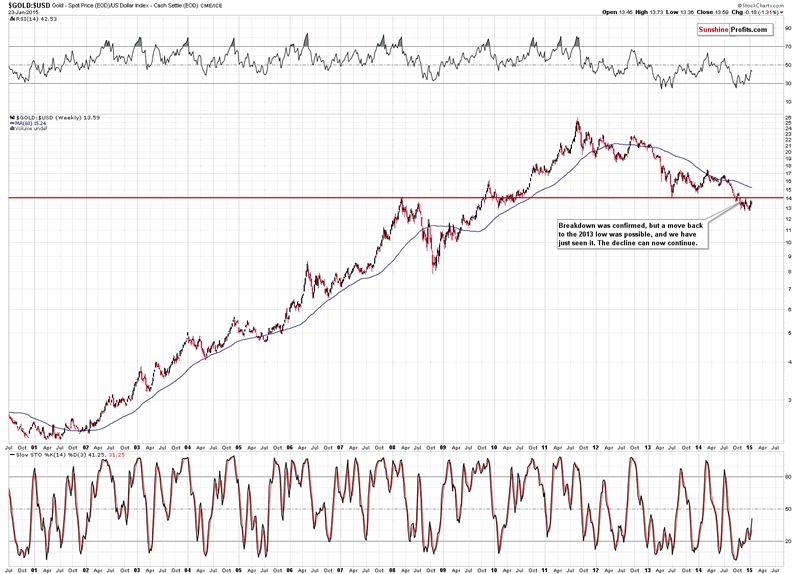
The chart featuring the gold to USD Index ratio clearly suggests so. The ratio moved a bit higher recently, but didn’t manage to move back above the strong resistance created by the 2013 low and the 2008 high. The medium-term trend remains down.
On Friday we wrote the following:
We have a similar situation in silver. The white metal moved higher, but only slightly above the 2013 low. The breakout could be invalidated any day now, especially given the size of the rally and comparing it to what caused it.
We have just seen an invalidation of the breakout as silver moved visibly back below the 2013 low. We wrote about silver’s “ability” to “break out” before declining once again multiple times in the past so those who have been following our analysis for some time should not be surprised by this invalidation. The implications are bearish.
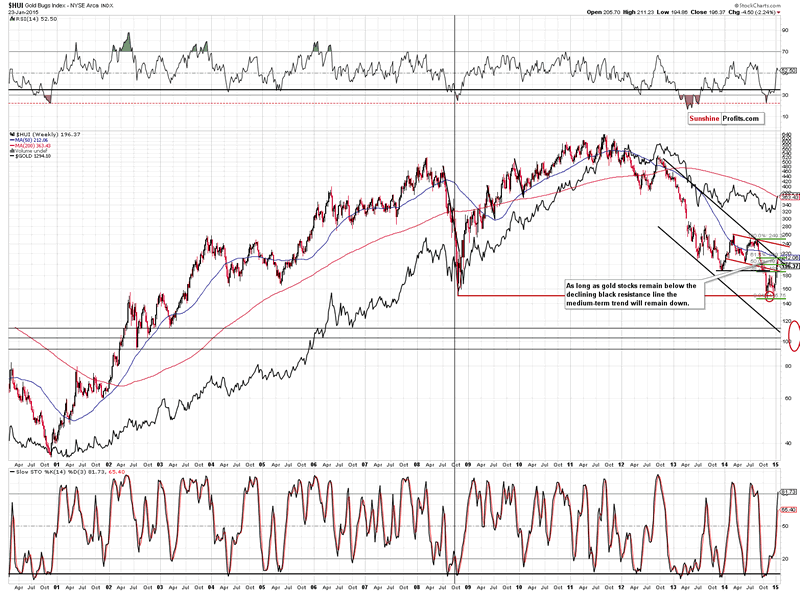
There was no breakout in gold stocks, which was one of the factors that made us doubt the breakout in silver.
In the previous alerts we wrote the following:
The 3 important resistance levels intersect close to the 210 level: the 61.8% Fibonacci retracement, the 50-week moving average, and – most importantly – the declining long-term resistance line. If gold stocks manage to break and confirm the breakout above this level, it might serve as a confirmation that another major upswing is underway. For now, the current rally looks similar to the corrections that we saw in July 2013, in late-2013 to early-2014, and in June 2014.
This resistance (combination of resistances) was reached (…). The HUI Index is either about to break out or about to decline once again. Since there has been no breakout so far, the odds are that it will decline once again.
We already saw a decline yesterday (which was more visible than the one seen in gold), so we have a small indication that we’ll see another decline shortly. To be honest, that’s not a strong indication. Since gold stocks reached a strong resistance after a visible rally, then a pullback is to be expected and is not necessarily a sign of big weakness. It is more bearish than not, though.
Yesterday, gold stocks had a good reason to rally (Euro-QE announcement) but they didn’t – they declined. Consequently, it seems that the decline was indeed indicating weakness in the precious metals market.
As soon as the HUI Index moves back below its 2013 low and this move is confirmed, it will make further – significant – declines much more likely.
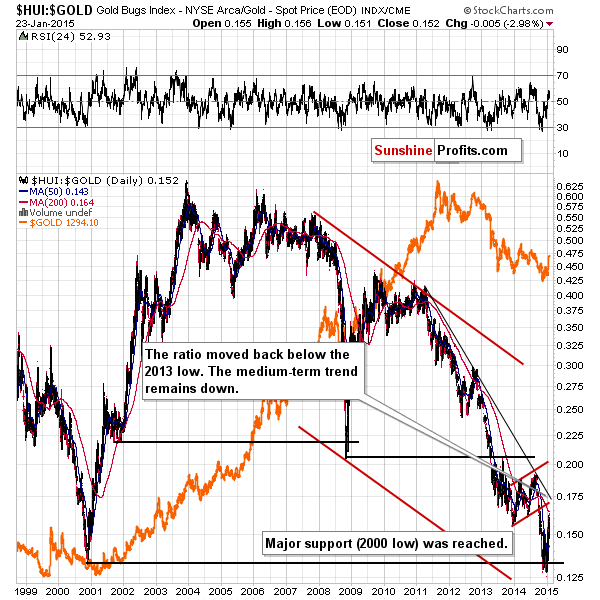
The HUI to gold ratio has already closed back below its 2013 low, so the bearish indications are present.
Summing up, based on the announcement of the QE program in the Eurozone, the situation in the precious metals market improved for the medium and long term, but based on the gold’s, silver’s and – most importantly – mining stocks’ reaction, the outlook deteriorated for the short term. Today’s bearish action in the precious metals confirms the above.
It seems that keeping the short positions in the precious metals is justified from the risk/reward perspective at this time as the profits on them are likely (in our opinion) to become even bigger. The trade is risky, so we are still using a limited amount of capital. We will likely increase it if we see additional bearish confirmations in the coming days.
We will be re-evaluating these positions on a daily basis. As always, we'll keep our subscribers updated should our views on the market change. We will continue to send them our Gold & Silver Trading Alerts on each trading day and we will send additional ones whenever appropriate. If you'd like to receive them, please subscribe today or sign up for our free mailing list today.
To summarize:
Trading capital (our opinion): Short positions (half) in gold, silver and mining stocks with the following stop-loss orders and initial (!) target prices:
Gold: initial target level: $1,245; stop-loss: $1,318, initial target level for the DGLD ETN: $64.60 ; stop loss for the DGLD ETN $55.00
Silver: initial target level: $16.73 ; stop-loss: $18.63, initial target level for the DSLV ETN: $55.63 ; stop loss for DSLV ETN $41.94
Mining stocks (price levels for the GDX ETN): initial target level: $20.40 ; stop-loss: $24.23, initial target level for the DUST ETN: $15.55 ; stop loss for the DUST ETN $9.28
In case one wants to bet on lower junior mining stocks' prices, here are the stop-loss details and initial target prices:
GDXJ: initial target level: $25.43 ; stop-loss: $32.17
JDST: initial target level: $10.50 ; stop-loss: $5.19
Long-term capital (our opinion): Half positions in gold, half positions in silver, half position in platinum and half position in mining stocks.
Insurance capital (our opinion): Full position
You will find details on our thoughts on gold portfolio structuring in the Key Insights section on our website.
As always, we'll keep our subscribers updated should our views on the market change. We will continue to send them our Gold & Silver Trading Alerts on each trading day and we will send additional ones whenever appropriate. If you'd like to receive them, please subscribe today.
Thank you.
Przemyslaw Radomski, CFA
Founder, Editor-in-chief
Tools for Effective Gold & Silver Investments - SunshineProfits.com
Tools für Effektives Gold- und Silber-Investment - SunshineProfits.DE
* * * * *
About Sunshine Profits
Sunshine Profits enables anyone to forecast market changes with a level of accuracy that was once only available to closed-door institutions. It provides free trial access to its best investment tools (including lists of best gold stocks and best silver stocks), proprietary gold & silver indicators, buy & sell signals, weekly newsletter, and more. Seeing is believing.
Disclaimer
All essays, research and information found above represent analyses and opinions of Przemyslaw Radomski, CFA and Sunshine Profits' associates only. As such, it may prove wrong and be a subject to change without notice. Opinions and analyses were based on data available to authors of respective essays at the time of writing. Although the information provided above is based on careful research and sources that are believed to be accurate, Przemyslaw Radomski, CFA and his associates do not guarantee the accuracy or thoroughness of the data or information reported. The opinions published above are neither an offer nor a recommendation to purchase or sell any securities. Mr. Radomski is not a Registered Securities Advisor. By reading Przemyslaw Radomski's, CFA reports you fully agree that he will not be held responsible or liable for any decisions you make regarding any information provided in these reports. Investing, trading and speculation in any financial markets may involve high risk of loss. Przemyslaw Radomski, CFA, Sunshine Profits' employees and affiliates as well as members of their families may have a short or long position in any securities, including those mentioned in any of the reports or essays, and may make additional purchases and/or sales of those securities without notice.
Przemyslaw Radomski Archive |
© 2005-2022 http://www.MarketOracle.co.uk - The Market Oracle is a FREE Daily Financial Markets Analysis & Forecasting online publication.