


The Most Overlooked “Buy” Signal in the Stock Market
Stock-Markets / Stock Markets 2015 Jan 27, 2015 - 04:59 PM GMTBy: Investment_U

 Editorial Note: With the Dow opening at a loss of 285 points, today’s featured article couldn’t have been timed better. Below, Matthew Carr shares his favorite metric for determining whether a market is a “Buy” or “Sell.” We hope you’re able to put this information to good use.
The markets are flashing red.
Your palms are starting to sweat.
Should you sell? Should you buy?
Is this the bottom? Or the beginning of the end?
For investors, these are the questions we are confronted with. It’s not a game. Our futures - our retirements - are at stake.
That’s why we’re always looking for an advantage. A telltale signal. Something that can tell us whether a stock is a “Buy” or a “Sell.” Whether we should plow into the market or wait for a pullback.
Or simply hit the eject button.
There are a ton of indicators you could use... A parade of technical gauges that traders proclaim have the magic formula for predicting when to get in and when to get out.
In my previous job as a researcher for one of the nation’s top global energy publications, I was trained to use many of these gauges, with the goal of forecasting day-ahead prices for commodities.
It’s what allows me to tell you this secret.
If you’re intimate with the data - if you spend your days compiling trades at various points - and you have an accurate weather forecast, you can predict the short-term moves of commodities with a great deal of accuracy.
That’s because no matter how fancy a technical tool might be, they are all ultimately based on the same thing: human psychology and emotion.
You can sum it up like this...
When things are going well, they have to turn bad. And when things are going badly, they can only get so bad before they turn good again.
We all get that nervous feeling in our guts when things are going a little too well - for too long - in our lives. We end up looking over our shoulder, wondering when the shoe is going to drop.
Yin and yang. Contrary forces that are complimentary, always striving for balance... That’s the most basic explanation of technical indicators.
Over the years, I’ve boiled the technical side of my analysis down to a few very simple pieces. Including one that is often overlooked and ignored - my “Buy” signal.
Moving On Up
You’re probably familiar with moving averages. These are just average close prices over a set period of time.
The most popular are the 50-day moving average and the 200-day moving average. They’re the two most touted technical signals, providing resistance (top) or support (bottom) for shares of a company or an index.
They’re also considered the most important. Because as these two averages interact with one another, you get two very different and very popular indicators: The Golden Cross and The Death Cross.
The Golden Cross is when the 50-day moving average of a stock rises above the 200-day moving average. It’s a bullish sign. Shares of that company will almost certainly move up.
The Death Cross is when the 50-day moving average falls below the 200-day moving average. It’s a bearish sign. Shares of that company will likely continue to move lower.
During a pullback or a sell-off, these are two of the levels that are eyed the most closely...
Though their significance, especially when compared to other less popular moving averages, can be debated - which is what I’m going to do now.
The Third Wheel
Let’s look at the S&P 500 for the past two years. And we’ll include the 50-day moving average and the 200-day moving average...
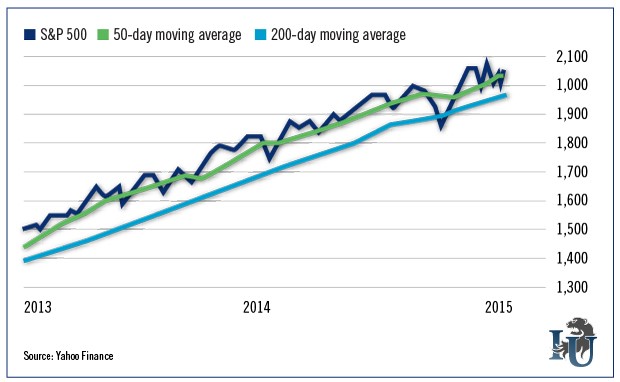
On the far right of the chart - this month - we see the 50-day moving average trying to provide some support. It did the same thing in the middle of 2014 (notice how it rides the line as support again).
The S&P 500 bounced off it a few times in 2013 as well.
The 200-day moving average, meanwhile, is “correction” level. The S&P 500 dipped below this on its way to a 10% correction in October of last year. But other than that, the metric isn’t that key.
Now, let’s throw in an average that’s often overlooked but has been far more relevant to the S&P for the last two years: the 100-day moving average.
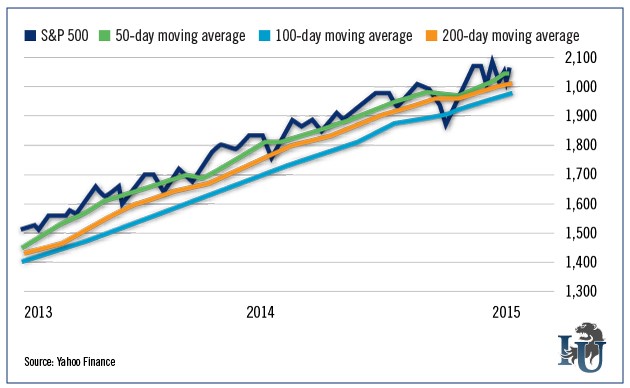
When we add this in, we get a true support line.
Since June 2013, the 100-day moving average level has marked the bottom of nearly every pullback and sell-off. Including the last three violent pullbacks in January and December.
The only one it didn’t capture was the 10% correction in October. But intuition told us that we were going to get a 10% correction because we’d already seen one that year from the Nasdaq, biotechs and the Russell 2000.
Plus we had oil plummeting and third quarter earnings on the horizon. We needed a shakeout.
Nonetheless, this 100-day moving average has been our “Buy” level in my Emerging Trends Trader research service.
Every time the S&P has pulled back to this level, we’ve looked to add to our portfolio. Because nine times in the last two years, this level has been our area of support.
But what about other indexes?
Well, let’s use those same three moving averages and take a peek at the Nasdaq for the past two years.
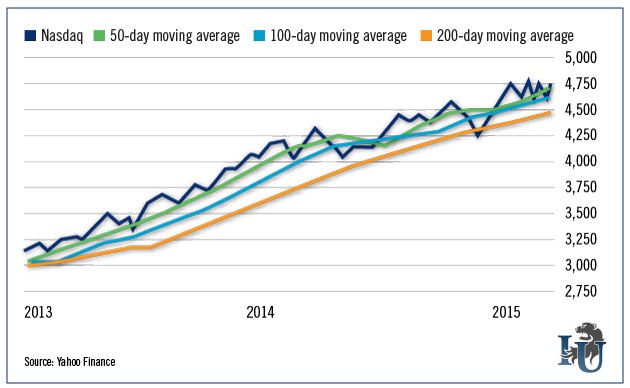
It hasn’t been as significant to the Nasdaq as it has to the S&P 500. But again, the last three pullbacks all bottomed out at the 100-day moving average.
And just like the S&P 500, the 50-day moving average provided support in 2013, while the 100-day moving average provided support for any more significant pullbacks.
The Nasdaq had a fairly volatile 2014, but the 100-day moving average is our near-term support level.
In other words, it’s a good “Buy” signal from this index, since it shows we’re at or near the bottom of a pullback.
Over the past couple months I’ve written extensively that January is not the great month for stocks many proclaim it to be. For example, it’s the third worst month of the year for the Russell 2000. And the fourth worst month for the Dow.
January is notoriously full of volatility and down days - a perception normally reserved for September and October.
But we play - and profit from - this volatility by targeting the 100-day moving average. This has consistently been our signal that a bottom has been reached.
Now, a lot of critics of all forms of technical analysis will claim this is all just a self-fulfilling prophecy... and that’s completely true. That’s also the beauty of it. Technical analysis gives rules to a system that is complex... that has billions of shifting variables each and every day.
You can choose to ignore it or you can add it to your arsenal. Doing the latter will help give you some direction on days when you’re asking yourself, “Do I buy? Or do I sell?”
Good investing,
Matthew
Copyright © 1999 - 2015 by The Oxford Club, L.L.C All Rights Reserved. Protected by copyright laws of the United States and international treaties. Any reproduction, copying, or redistribution (electronic or otherwise, including on the world wide web), of content from this website, in whole or in part, is strictly prohibited without the express written permission of Investment U, Attn: Member Services , 105 West Monument Street, Baltimore, MD 21201 Email: CustomerService@InvestmentU.com
Disclaimer: Investment U Disclaimer: Nothing published by Investment U should be considered personalized investment advice. Although our employees may answer your general customer service questions, they are not licensed under securities laws to address your particular investment situation. No communication by our employees to you should be deemed as personalized investment advice. We expressly forbid our writers from having a financial interest in any security recommended to our readers. All of our employees and agents must wait 24 hours after on-line publication or 72 hours after the mailing of printed-only publication prior to following an initial recommendation. Any investments recommended by Investment U should be made only after consulting with your investment advisor and only after reviewing the prospectus or financial statements of the company.
Investment U Archive |
© 2005-2022 http://www.MarketOracle.co.uk - The Market Oracle is a FREE Daily Financial Markets Analysis & Forecasting online publication.