


Cocoa Commodity Price Technical Outlook
Commodities / Cocoa Mar 21, 2015 - 10:50 AM GMTBy: Austin_Galt

 Cocoa is the basis of chocolate. The word cocoa is derived from the Spanish word cacao as the cacao tree is native to Latin America. It originated in the Amazon and Orinoco basins which are in Colombia and Venezuela. However, it is now West Africa which dominates world production of cocoa with the Ivory Coast being by far the largest producer.
Let's investigate the technicals of the cocoa price taking a top down approach beginning with the yearly chart.
Cocoa Yearly Chart
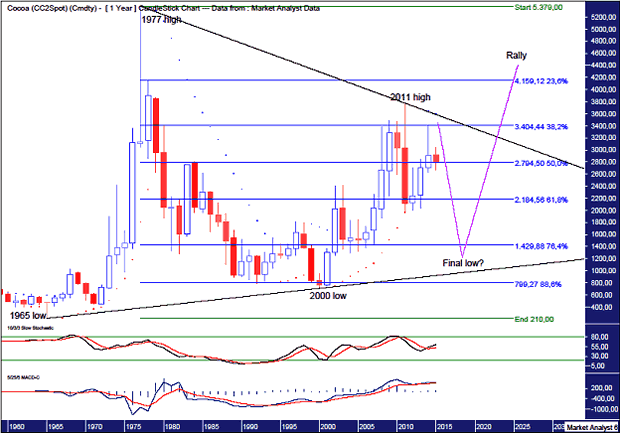
I have drawn a downtrend line connecting the 1977 and 2011 highs and an uptrend line connecting the 1965 and 2000 lows. This sets up a massive consolidation zone in which price is currently trading. Price is near resistance from the downtrend line and I think price can give this trend line one more test before heading back down.
The Parabolic Stop and Reverse (PSAR) indicator has a bearish bias with the dots above price. I am looking for price to trade up and fall just short of taking these dots out which currently stand at US$3604.
The Stochastic indicator currently has a bullish bias but it is not looking very strong and it wouldn't surprise to see it roll over.
The Moving Average Convergence Divergence (MACD) indicator still has a bullish bias with the blue line above the red line but it looks to be tiring.
I have added Fibonacci retracement levels of the move up from 1965 low to 1977 high. The 2000 low was right at support from the 88.6% level and I favour the next major low to be around the 76.4% level which stands at US$1429 and perhaps a touch low.
I doubt price will trade back to the uptrend line instead putting in a major low just above it.
Let's move on to the monthly chart
Cocoa Monthly Chart
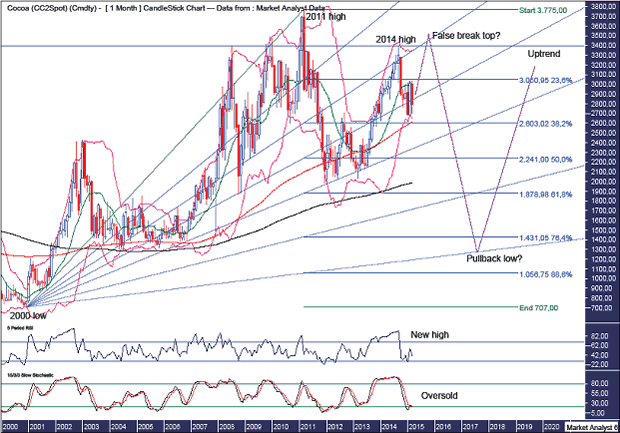
The Bollinger Bands show price came right back down to and bounced off the lower band. Price now looks to be testing that low of US$2669 but as long as that low holds then I favour a move up to new rally highs.
I have drawn a horizontal line at the 2014 high at US$3399. I am expecting price to trade marginally above there before turning back down thereby putting in a false break top.
From the yearly analysis, we know PSAR resistance is at US$3604. Therefore, I expect the final rally high to be below there and above US$3399.
The Relative Strength Indicator (RSI) made a new high reading at the 2014 high. I would like to see the final rally high be accompanied by a lower reading - a bearish divergence. Let's see.
The Stochastic indicator is looking oversold so a move back up now would be no surprise here.
I have added moving averages with time periods of 100 (red) and 200 (black) which is evidence of the bull trend in play with the 100ma being well above the 200ma. The red line also looks to be providing support for the recent move down.
I have drawn a Fibonacci Fan and I expect the final rally high to be around resistance from the 38.2% angle which also provided resistance for the 2014 high. I then expect the final pullback low to be around the 88.6% angle.
I have added Fibonacci retracement levels of the move up from 2000 low to 2011 high and I expect the final pullback low to be at least back to the 76.4% level which stands at US$1431 and perhaps a touch lower.
Let's now skip to the daily chart for a closer look.
Cocoa Daily Chart
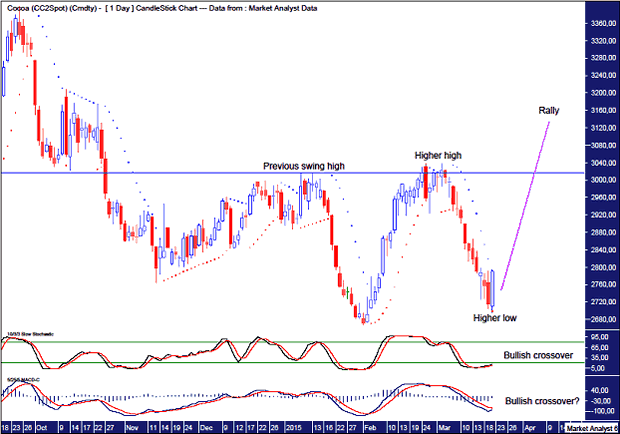
I have drawn a horizontal line which denotes the previous swing high level set at US$3016 in January 2015. Price recently busted marginally above that line thereby putting in a higher low.
Today price looks to have turned back up after putting in a higher low with a big bullish outside reversal candle. I now expect price to rally to new highs once again.
The PSAR resistance, denoted by the dots, was nailed by the big reversal higher today.
The Stochastic indicator shows a bullish crossover while the Moving Average Convergence Divergence (MACD) indicator looks to be threatening on.
So, it looks like it's up, up and away now before being down and out a bit further into the future.
And as for my favourite kind of chocolate - milk chocolate or dark chocolate? Nope, Sexual Chocolate from that great movie, Coming To America. Take it away Randy Watson... https://www.youtube.com/watch?v=KzANAr1V82c
By Austin Galt
Austin Galt is The Voodoo Analyst. I have studied charts for over 20 years and am currently a private trader. Several years ago I worked as a licensed advisor with a well known Australian stock broker. While there was an abundance of fundamental analysts, there seemed to be a dearth of technical analysts. My aim here is to provide my view of technical analysis that is both intriguing and misunderstood by many. I like to refer to it as the black magic of stock market analysis.
Email - info@thevoodooanalyst.com
© 2015 Copyright The Voodoo Analyst - All Rights Reserved
Disclaimer: The above is a matter of opinion provided for general information purposes only and is not intended as investment advice. Information and analysis above are derived from sources and utilising methods believed to be reliable, but we cannot accept responsibility for any losses you may incur as a result of this analysis. Individuals should consult with their personal financial advisors.
Austin Galt Archive |
© 2005-2022 http://www.MarketOracle.co.uk - The Market Oracle is a FREE Daily Financial Markets Analysis & Forecasting online publication.