


Western Interest in Gold Continues to Decline
Commodities / Gold and Silver 2015 Apr 13, 2015 - 02:11 PM GMTBy: Dan_Norcini

 Gold has managed to avoid a complete chart breakdown thus far but that is due more to buying in the physical market out of the far East rather than any wholesale interest among the high-powered, deep-pocketed, Western-investment crowd. As noted many times here at this site, it is my firm opinion that while buying out of China and India can hold the price and form a floor in the gold market, it CANNOT drive the price sharply higher as so many rabid gold bugs have their hearts set on happening. That requires the momentum-based crowd which chases prices higher due to chart signals and could care less about what any perceived "value" area might be for gold, or for that matter, any other market that they ply their computers in.
Take a look at two different charts indicating the lackluster Western-based demand for the metal at the current time.
The first is the chart we regular feature here, namely, that of the reported gold holdings out of the largest gold ETF, GLD.
GLD Holdings versus Gold price
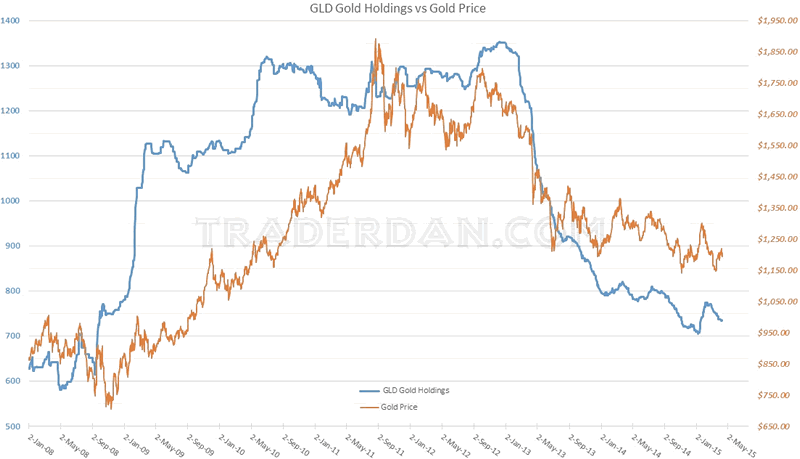
For the week, GLD lost 3 tons of gold dropping the total holdings down to 734 tons. Thus far this year, the ETF has added a mere 25 tons of gold, far off the torrid pace that looked as if it might mark a change in sentiment back in February when it had already managed to add a significant 64 tons. The bloom appears to already be off the rose as far as this investment vehicle is concerned.
Confirming this trend away from gold and into equities, especially European equities, is this most recent chart of the Commitment of Traders report. One can see the general decline from left to right of the line representing TOTAL OPEN INTEREST in gold futures.
Gold COT
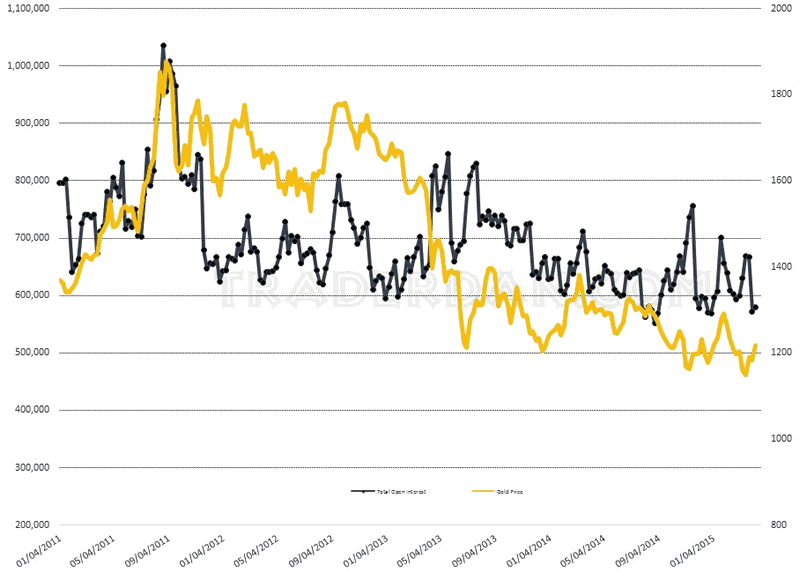
Notice how the gold price tends to rise and fall with each rise and fall in the total open interest line. This serves to illustrate my view that it is large speculative interests ("open interest") that drive our markets. Without that speculative interest in the market, there is no driver, no thrust to push prices significantly higher. Instead, what one gets is a grinding type of choppy, often random and meaningless, back and forth, up and down, sort of price action without any sort of clearly defined trend. In almost every case in which I see this pattern of lackluster speculative interest, the result is a gradual decline in price over time. We are currently seeing that exhibited in gold.
Look at the weekly price chart of the metal and you can see what I am referring to. This is the kind of price action that bores most trader half to death. The ADX line continues to decline revealing the lack of any clear trend while the RSI is stuck in no-man's land, moving sideways in exactly the same fashion as does the price.
Weekly Gold Chart 1
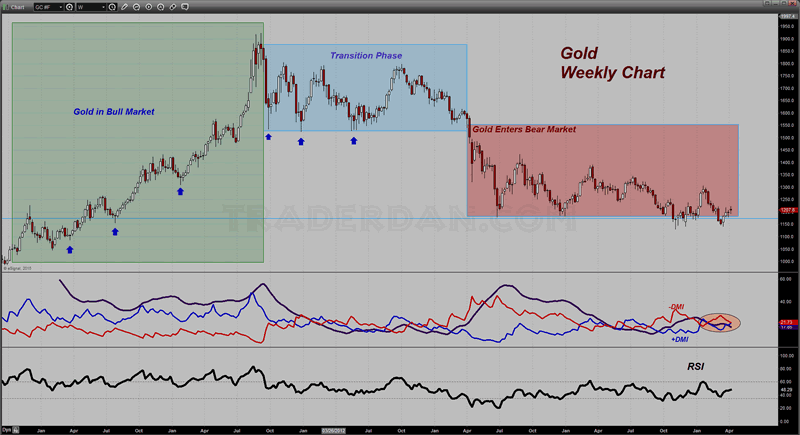
If you look more closely at the Directional Movement Indicator lines, you can see them crossing back and forth above each other as each side, the bulls or the bears, gains a temporary, but short-lived advantage over the other. Contrast that movement in the directional lines with their action during the strong trending phases.
Weekly Gold Chart 2
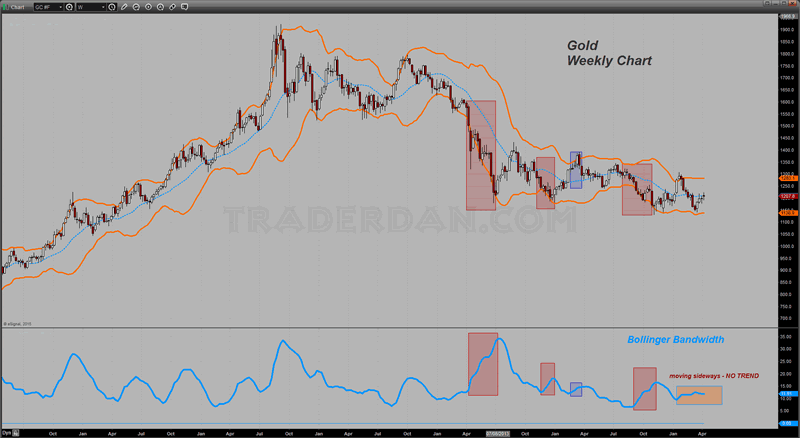
Taking a look at the same weekly chart but this time using the Bollinger Bands to get some insight into the price action one is struck by the relatively flatlining of the Bandwidth indicator for most of the year 2015 thus far. The bands are essentially moving parallel to each other which confirms the ADX reading. In other words, the market is going nowhere fast.
Bulls cannot get a single thing going to the upside of any duration while bears, able to forge a series of LOWER HIGHS, cannot seem to break it down below support which emerges near $1150. (note - no doubt that support is due to buying out of India and China).
Weekly Gold Chart 3

However, one thing to note -- since gold broke down in April of 2013 and entered its bear market, 3 out of 4 upward turns in the Bollinger Bandwidth indicator have all occurred during DOWNWARD TRENDING MOVES. Those are highlighted in red rectangles. There was one brief-lived move higher that turned the bandwidth indicator higher as well back in early 2014 when gold managed to mount an early year rally (much as it did this year) before falling apart after hitting solid resistance at the $1400 level.
What this tells us is that moves higher in gold are short-lived and are COUNTER to the longer term trend currently in place which is DOWN. They have most recently tended to consist MAINLY of SHORT COVERING which then burns itself out rather quickly.
Gold Shorts
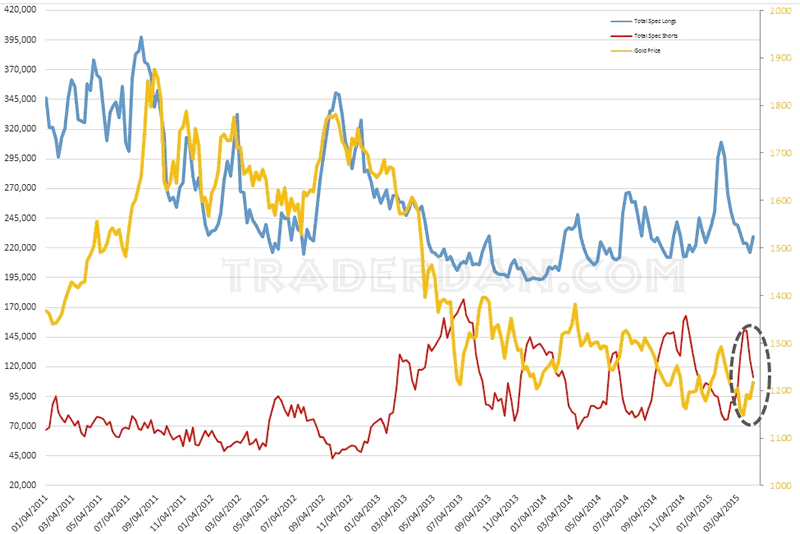
You can see this from this chart noting the total speculative long and short positions in gold (note - these are outright positions, not net positions). Look at the area within the ellipse on the chart and you can see the sharp drop in outright short positions among the speculators. Specs have covered a whopping 40K short positions over the last two reporting weeks with a corresponding $60 rise in the gold price. If you look at the number of speculative long positions higher up on the chart, you can see that it barely moved higher over that same time frame. Only 5000 new long positions have been added in the same speculative category!
Weekly Gold Chart 4

Referring back to the weekly chart, the trend lower in gold has slowed as gold has moved lower in price which is not unexpected; however, one does wonder just how much longer gold can manage to claw its way back upwards from chart support given that the bulk of any increased volatility in this market (as accompanied by an expansion of the Bollinger bands) is always to the downside.
One gets the increasing sense that gold is living on borrowed time and that were it not for what is perceived to be only a lull in the eventual first rate hike by the Fed, gold would already be trading below chart support. I should note here that as of today, the Fed futures market is predicting a 100% chance of a rate hike by December of this year. That is of course a much longer way off than the previously viewed June hike but it is still revealing in the sense that the broad market consensus at this time is a rate hike this year. Probability of a move higher in September is 42% as of today.
There is always some support that gold will be able to attract due to geopolitical concerns especially in the volatile middle-East and some lingering concerns over things related to Greece, overall sluggish global economic growth, etc. but if the market concerns over such things begins to subside, so too will buying interest in gold decline that much the more.
In other words, gold bugs are going to need to rely increasingly upon their "end of the world as we know it" scenarios to allow their beloved yellow metal god to soar upward in price. As I have said before, it is a particularly morbid outlook that one has to adopt in order to be perennially bullish on gold. While one can be realistic and not be a Pollyanna about current stress factors in the financial system (and there are some), that is a far cry from gleefully fawning over every piece of economic data that is not wildly bullish and spinning that into more evidence of impending economic collapse.
Just look at the price charts, try to understand what they are telling us about sentiment and thus money flows, and you will be far more informed than the gold cult devotees and a lot more balanced as a trader/investor.
Dan Norcini
Dan Norcini is a professional off-the-floor commodities trader bringing more than 25 years experience in the markets to provide a trader's insight and commentary on the day's price action. His editorial contributions and supporting technical analysis charts cover a broad range of tradable entities including the precious metals and foreign exchange markets as well as the broader commodity world including the grain and livestock markets. He is a frequent contributor to both Reuters and Dow Jones as a market analyst for the livestock sector and can be on occasion be found as a source in the Wall Street Journal's commodities section. Trader Dan has also been a regular contributor in the past at Jim Sinclair's JS Mineset and King News World as well as may other Precious Metals oriented websites.
Copyright © 2015 Dan Norcini - All Rights Reserved
All ideas, opinions, and/or forecasts, expressed or implied herein, are for informational purposes only and should not be construed as a recommendation to invest, trade, and/or speculate in the markets. Any investments, trades, and/or speculations made in light of the ideas, opinions, and/or forecasts, expressed or implied herein, are committed at your own risk, financial or otherwise. The information on this site has been prepared without regard to any particular investor’s investment objectives, financial situation, and needs. Accordingly, investors should not act on any information on this site without obtaining specific advice from their financial advisor. Past performance is no guarantee of future results.
Dan Norcini Archive |
© 2005-2022 http://www.MarketOracle.co.uk - The Market Oracle is a FREE Daily Financial Markets Analysis & Forecasting online publication.