


The Ball is in the Stock Market Bulls Court
Stock-Markets / Stock Markets 2015 Apr 14, 2015 - 12:24 PM GMT

 SPX
SPX
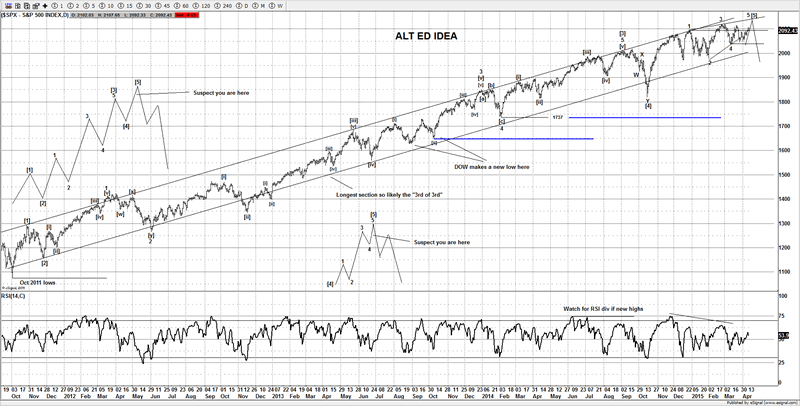
We went into last week with two ideas, with the bearish crowd proclaiming a crash was due once 2040SPX had been broken, it seems the majority of traders were just too bearish, low and behold as if by magic the magic hand comes to the rescue and supports the market in Globex. The move last week supports the idea now that the market is likely going to make a new all time highs for wave 5 of an ending diagonal, that's the preferred idea now, although we could see a small pullback, staying above 2060SPX helps the bullish case and target new highs towards 2125-40SPX.
SPX Chart 1
SPX Chart 2
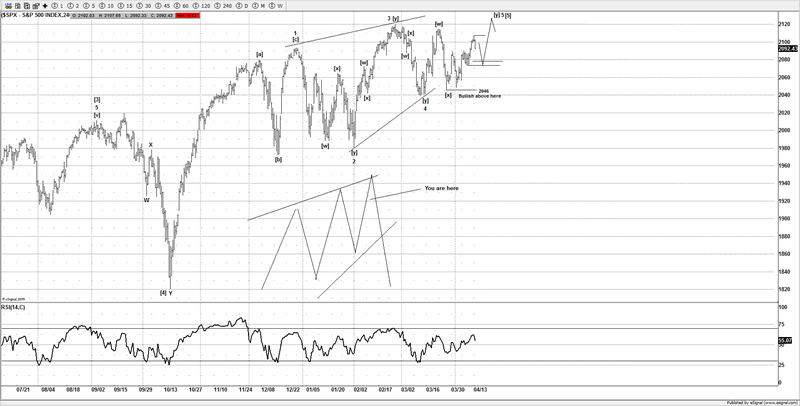
The prior idea I was using, is not technically invalid, it's just the fact the last week don't really support the idea of a major decline from these levels, I would much prefer to see new all time highs from here. Its then I would then start to slip back into the bear suit again. Currently it don't really offer a strong bullish or bearish setup, the bears really need to see it make a new all time high to complete its current pattern, ideally then we see the bulls all come out and sing kumbaya. If this pattern is correct, then its setting up for a large decline as it's a pattern that is seen in the terminal stages of a trend. It still needs a bit more upside, if we do see a new all time high we will be looking to fade the bullish crowd and look for a large decline.
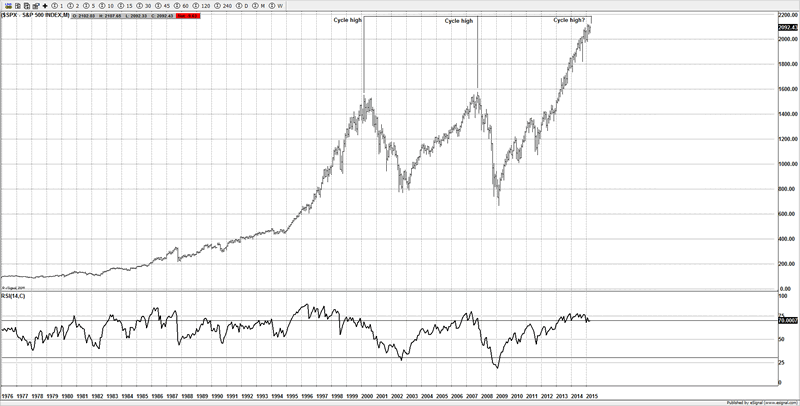
Cycle timing
I am not one for cycles, they seem to come and go, but this chart does stand out as something that could suggest some caution for the bulls, that and the suspected ending diagonal pattern I think is a combination that the bulls maybe want to at least acknowledge.
SPX Monthly Chart
US$ aka DXY
The US$ has been on a rampage the past few months, however we think the current trend is likely close to a reversal and setting up for a large decline. I suspect the current move is in wave 5 (alt idea is some variation of a corrective pattern for wave 4 such as a triangle). By staying above 98.00 supports the case for more upside and new yearly highs, we want to be watching for a strong RSI divergence, that will also support the idea of a 5th wave and potentially the trend that started from last May is coming to a termination.
US$ versus DXY
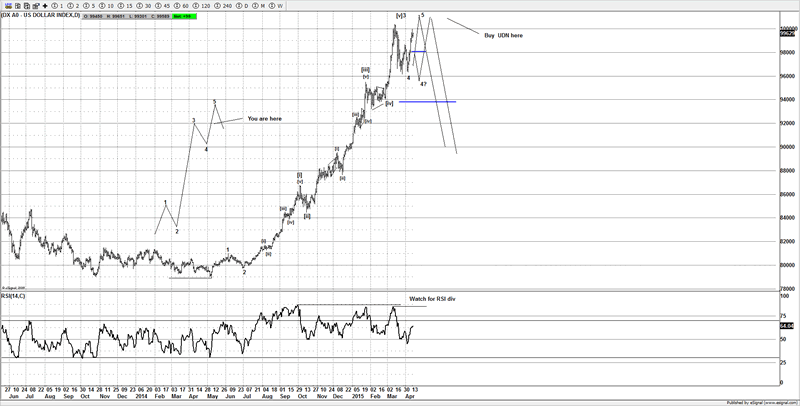
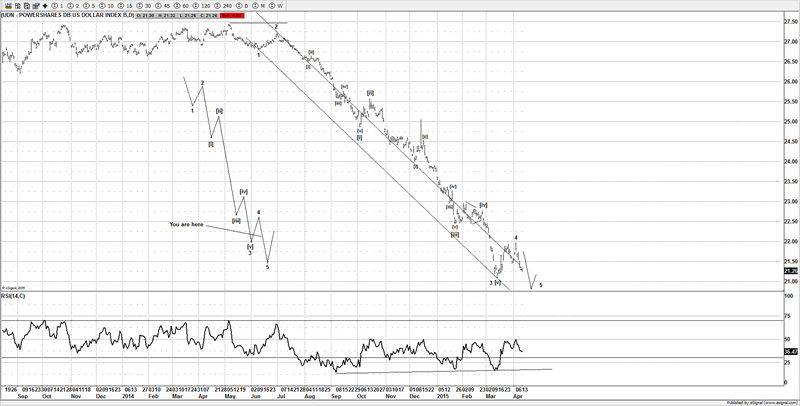
One way to play a move lower in the US$ is to buy UDN, this is basically a mirror image of the EURUSD, but this is a cheaper way to play a trend move, if we are correct on the US$ and the US stock markets are coming to the end of the trend that started from the Oct 2011 lows, then both these trends will be macro trend moves, that we will be seeing a multi-month corrections, so ideal for swing traders.
Pwershares US $ Index
Until next time
Have a profitable week ahead
Click here to become a member
You can also follow us on twitter
What do we offer?
Short and long term analysis on US and European markets, various major FX pairs, commodities from Gold and silver to markets like natural gas.
Daily analysis on where I think the market is going with key support and resistance areas, we move and adjust as the market adjusts.
A chat room where members can discuss ideas with me or other members.
Members get to know who is moving the markets in the S&P pits*
*I have permission to post comments from the audio I hear from the S&P pits.
If you looking for quality analysis from someone that actually looks at multiple charts and works hard at providing members information to stay on the right side of the trends and making $$$, why not give the site a trial.
If any of the readers want to see this article in a PDF format.
Please send an e-mail to Enquires@wavepatterntraders.com
Please put in the header PDF, or make it known that you want to be added to the mailing list for any future articles.
Or if you have any questions about becoming a member, please use the email address above.
If you like what you see, or want to see more of my work, then please sign up for the 4 week trial.
This article is just a small portion of the markets I follow.
I cover many markets, from FX to US equities, right the way through to commodities.
If I have the data I am more than willing to offer requests to members.
Currently new members can sign up for a 4 week free trial to test drive the site, and see if my work can help in your trading and if it meets your requirements.
If you don't like what you see, then drop me an email within the 1st 4 weeks from when you join, and ask for a no questions refund.
You simply have nothing to lose.
By Jason Soni AKA Nouf
© 2015 Copyright Jason Soni AKA Nouf - All Rights Reserved
Disclaimer: The above is a matter of opinion provided for general information purposes only and is not intended as investment advice. Information and analysis above are derived from sources and utilising methods believed to be reliable, but we cannot accept responsibility for any losses you may incur as a result of this analysis. Individuals should consult with their personal financial advisors.
WavePatternTraders Archive |
© 2005-2022 http://www.MarketOracle.co.uk - The Market Oracle is a FREE Daily Financial Markets Analysis & Forecasting online publication.