


The Rich Get Richer
Politics / Social Issues May 10, 2015 - 04:09 AM GMTBy: Mike_Whitney

 Why are stocks still flying-high when the smart money has fled overseas and the US economy has ground to a halt?According to Marketwatch:
“For the eighth week in a row, long-term mutual funds saw more money flowing out of U.S. stocks and into international stocks, according to the Investment Company Institute……For the week ended April 22, U.S. stocks saw $3.4 billion in net outflows from long-term mutual funds…For the year to date, net outflows for U.S. stocks are $13.79 billion, while inflows for international stocks are $41.12 billion.
Those figures, however, don’t count exchange-traded funds. In April alone, mutual funds and ETFs that focus on international stocks saw $31.8 billion in net inflows, while U.S.-focused funds and ETFs shed $15.4 billion, according to TrimTabs Investment Research.” (“Why U.S. stocks are near highs even as fund investors flee“, Marketwatch)
So if retail investors are moving their cash to Europe and Japan (to take advantage of QE), and the US economy is dead-in-the-water, (First Quarter GDP checked in at an abysmal 0.1 percent) then why are stocks still just two percent off their peak?Answer: Stock buybacks.The Fed’s uber-accommodative monetary policy has created an environment in which corporate bosses can borrow boatloads of money at historic low rates in the bond market which they then use to purchase their own company’s shares. When a company reduces the number of outstanding shares on the market, stock prices move higher which provides lavish rewards for both management and shareholders. Of course, goosing prices adds nothing to the company’s overall productivity or growth prospects, in fact, it undermines future earnings by adding more red ink to the balance sheet. But these “negatives” are never factored into the decision-making which focuses exclusively on short-term profits. Now get a load of this from Morgan Stanley via Zero Hedge:
“In 2014, the constituents of the S&P 500 on a net basis bought back ~$430Bn worth of common stock and spent a further ~$375Bn on dividend payouts. The total capital returned to shareholders was only slightly less than the annual earnings reported. On the fixed income front, the investment grade corporate bond market saw a record $577Bn of net issuance in 2014. While the equity and bond universes don’t overlap 100%, we think these numbers convey a simple yet important story. US corporations have essentially been issuing record levels of debt and using a significant chunk of their earnings and cash reserves to buy back record levels of common stock.” (“Buyback Bonanza, Margin Madness Behind US Equity Rally”, Zero Hedge)
So corporations are borrowing hundreds of billions of dollars from investors through the bond market. They’re using this cheap capital to repurchase shares in order to boost skyrocketing executive compensation and to line the pockets of their shareholders. At the same time, they are weakening the capital structure of the company by loading on more debt. (It’s worth noting that “highly rated U.S. nonfinancial companies” are now more leveraged than they were in 2007 just before the crash.)This madcap buyback binge has gotten so crazy, that buybacks actually exceeded profits in two quarters in 2014. Here’s the story from Bloomberg:
“Companies in the Standard & Poor’s 500 Index really love their shareholders….Money returned to stock owners exceeded profits in the first quarter and may again in the third. The proportion of cash flow used for repurchases has almost doubled over the last decade while it’s slipped for capital investments, according to Jonathan Glionna, head of U.S. equity strategy research at Barclays Plc.
Buybacks have helped fuel one of the strongest rallies of the past 50 years as stocks with the most repurchases gained more than 300 percent since March 2009.” (Bloomberg)
But maybe we’re being too pessimistic here. Maybe stocks would have risen anyway due to record high earnings and improvements in the economy. That’s possible, isn’t it?Nope. Not according to Morgan Stanley at least. Check it out:
“Since 2012, more than 50% of EPS growth in the S&P 500 has been driven by buybacks and growth ex-buybacks has been a mere 3.3% annualized. (EPS: Earnings Per Share)
“More than 50% “! There’s your market summary in one damning sentence. No buybacks means no 5-year stock market rally. Period. If it wasn’t for financial engineering and the Fed’s easy money, stocks would be in the same general location as the real economy, circling the plughole, that is.What’s so frustrating about the present phenom is that the Fed knows exactly what’s going on, but just looks the other way. So while the stock bubble gets bigger and bigger, CAPEX –which is investment in future productivity and growth– continues to deteriorate, GDP drops to zero, and demand gets progressively weaker. Shouldn’t that warrant a rethinking of the policy?Heck, no. The Fed is determined to stick with the same lame policy until hell freezes over. Whether it works or not is entirely irrelevant.Now take a look at this eye-popper from Wolf Street: “GE, in order to paper over a net loss of $13.6 billion and declining revenues in the first quarter, said on April 10 that it would buy back $50 billion of its own shares.” (Wolf Street)I can’t tell you how many times I’ve read similar stories in the last couple years. The company’s revenues are shrinking, they’re losing money hand over fist, and what do they do?They announce they’re going to buy back $50 billion of their own shares.What a joke. And it doesn’t stop there. The Fed’s policies have also ignited a flurry of activity in margin borrowing. This is from CNBC:
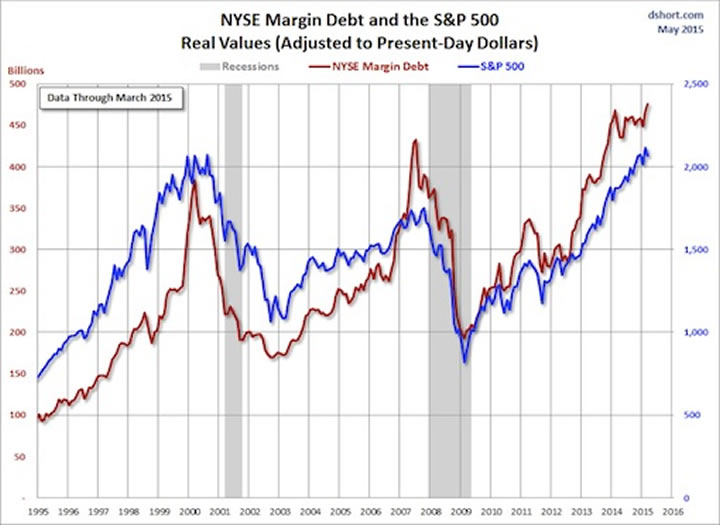
“NYSE margin debt rose to an all-time high in March, according to recently released data from the stock exchange….NYSE margin debt sat at $476.4 billion, up from $464.9 billion at the end of February..(Note: That’s $95 billion more than 2007 at the peak of the bubble.)
Margin debt is created when investors borrow money in order to buy stocks. If an investor buys $100 worth of stocks with $50 in capital, that individual has $50 of margin debt outstanding. Since margin debt provides leverage, it amplifies gains, but also increases the risk to an investor.” (“What record-high margin debt means for stocks”, CNBC)
More borrowing, more risk taking, more financial instability. And it’s all the Fed’s doing. If rates were neutral, then prices would normalize and CEOs would not be engaged in this reckless game of Russian roulette. Instead, it’s caution to the wind; just keep piling on the debt until the whole market comes crashing down in a heap like it did six years ago. And that’s the trajectory we’re on today, in fact, according to TrimTabs Investment Research, February saw buybacks in the amount of $104 billion, ” the largest monthly figure since these flows were first tracked 20 years ago. ”So things are getting worse not better. Bottom line: The Fed has led the country to the cliff-edge once again where the slightest uptick in interest rates is going to send the economy into freefall.But why? Why does the Fed keep steering the country from one financial catastrophe to the next?That’s a question that economists Atif Mian and Amir Sufi answer persuasively with one small chart. Check it out:“Here is the distribution of financial asset holdings across the wealth distribution. This is from the 2010 Survey of Consumer Finances:
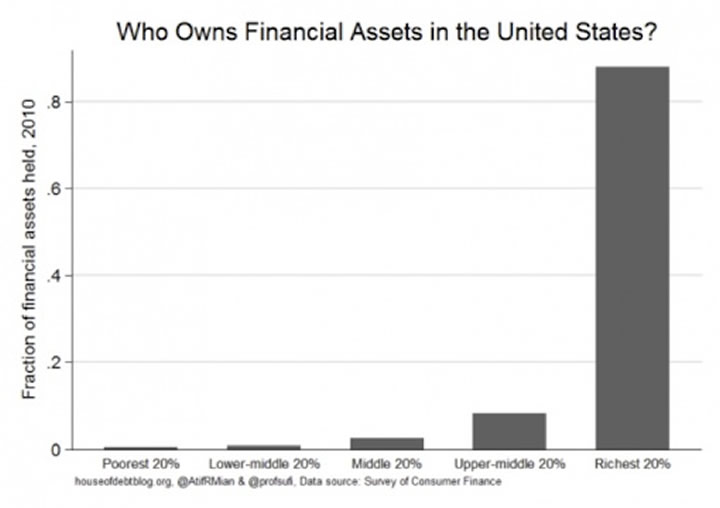
The top 20% of the wealth distribution holds over 85% of the financial assets in the economy. So it is clear that the direct income from capital goes to the wealthiest American households.” (Capital Ownership and Inequality, House of Debt)Why does the Fed create one bubble after the other?
Now you know.
By Mike Whitney
Email: fergiewhitney@msn.com
Mike Whitney lives in Washington state. He is a contributor to Hopeless: Barack Obama and the Politics of Illusion (AK Press). Hopeless is also available in a Kindle edition. He can be reached at fergiewhitney@msn.com.
© 2014 Copyright Mike Whitney - All Rights Reserved Disclaimer: The above is a matter of opinion provided for general information purposes only and is not intended as investment advice. Information and analysis above are derived from sources and utilising methods believed to be reliable, but we cannot accept responsibility for any losses you may incur as a result of this analysis. Individuals should consult with their personal financial advisors.
Mike Whitney Archive |
© 2005-2022 http://www.MarketOracle.co.uk - The Market Oracle is a FREE Daily Financial Markets Analysis & Forecasting online publication.