


Is Crude Oil Price Rally Over?
Commodities / Crude Oil May 11, 2015 - 12:13 PM GMTBy: Nadia_Simmons

 Trading position (short-term; our opinion): Short positions with a stop-loss order at $65.23 are justified from the risk/reward perspective.
On Friday, crude oil moved lower after the market’s open weakened by a stronger U.S. dollar. Despite this move, the commodity reversed and rebounded in the following hours, gaining 0.85% and closing the day above $59, but did this upswing change anything?
On Friday, the Department of Labor reported that the U.S. economy added 223,000 jobs in April, slightly below expectations for an increase of 224,000. The report also showed that the U.S. unemployment rate slipped to 5.4% in the previous month from 5.5% in March. These positive numbers supported the USD Index, which made crude oil less attractive for buyers holding other currencies. As a result, the commodity hit an intraday low of $58.14. Despite this drop, light crude rebounded in the following hours and climbed to $59.90 after Baker Hughes showed in its weekly report that the number of oil rigs in the U.S. fell by 11 to 668, marking the 22nd consecutive week of declines. Although the number of domestic oil rigs declined to its lowest level since September, 2010, the pace of decline continues to slow, which raised worries over another build in crude oil inventories and pushed the price little lower. Will we see further deterioration in the coming week? (charts courtesy of http://stockcharts.com).
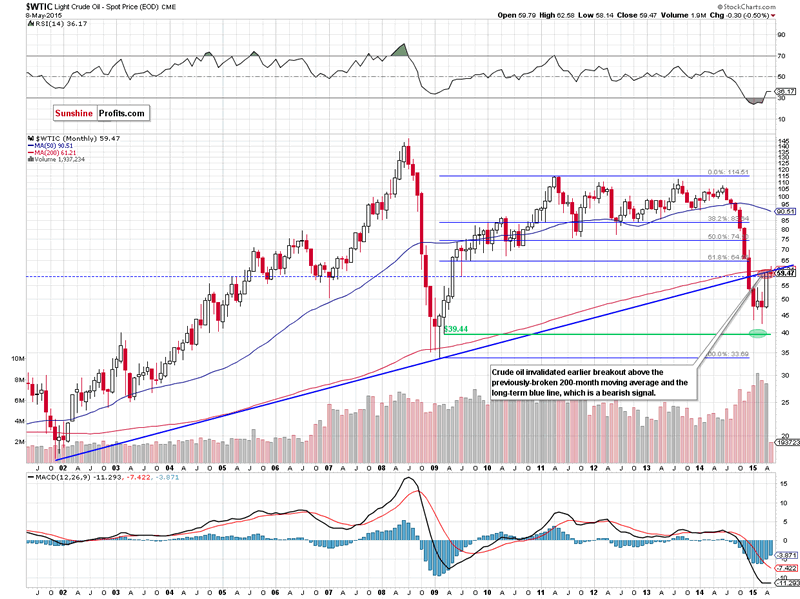
Looking at the long-term chart, we see that the overall situation hasn’t changed much as crude oil is still trading under the 200-month moving average and the long-term blue line. This means that Thursday’s invalidation of the breakout above them and its negative impact on future moves is still in effect.
Did Friday’s increase change the very short-term picture?
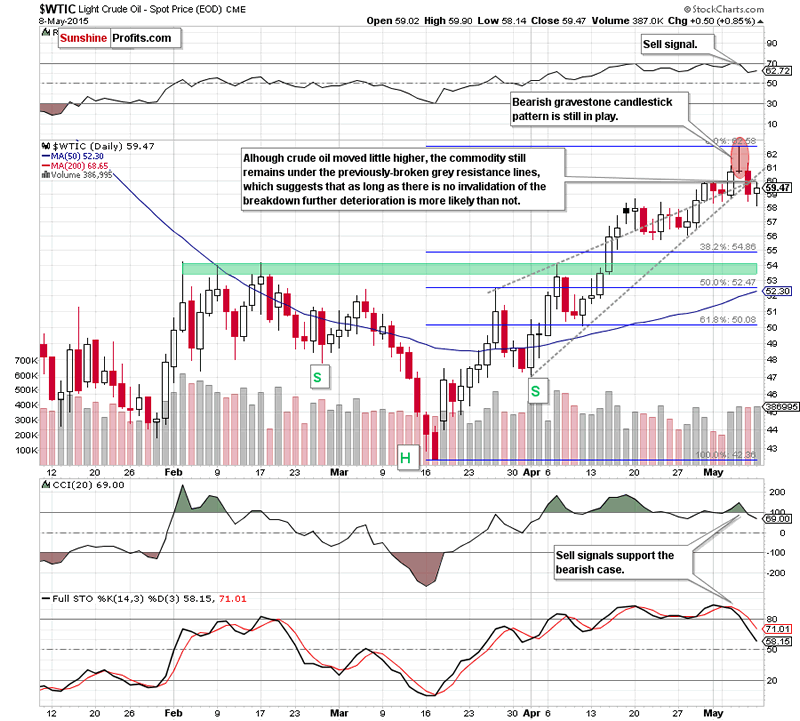
Not really. From this perspective, we see that crude oil moved little higher, but the previously-broken grey resistance lines stopped further improvement. Taking this fact into account, and combining it with sell signals generated by the indicators, the bearish gravestone candlestick formation and the long-term picture, we think that further deterioration is just around the corner.
If this is the case, and the commodity declines from here, Friday’s upswing would be nothing more than a verification of earlier breakdown below grey lines. If we see such price action, it would be a negative signal, which will likely encourage oil bears to act and result in further deterioration.
Taking all the above into account, we think that the commodity will extend declines and our downside targets from the previous Oil Trading Alert would be in play:
(…) the initial downside target would be around $55, where0 the 38.2% Fibonacci retracement based on the entire Mar-May rally is. If it is broken, the next target would be the green support zone created by the Feb highs ($54-$54.24). Please note that if this area is broken, the next targets would be around: $52.40 (the 50% Fibonacci retracement based on the entire Mar-May rally), $50 (the 61.8% retracement) or we might see a test of the Apr low of $47.
Summing up, although crude oil moved little higher on Friday, the commodity is still trading under the solid resistance zone created by the 200-month moving average, the long-term blue line and both short-term grey resistance lines. Additionally, invalidation of the breakout above these levels and its negative impact on future moves is still in effect, which suggests further deterioration (especially when we factor in sell signals generated b the indicators).
Very short-term outlook: bearish
Short-term outlook: bearish
MT outlook: mixed with bearish bias
LT outlook: mixed with bearish bias
Trading position (short-term; our opinion): Short positions with a stop-loss order at $65.23 are justified from the risk/reward perspective.
Thank you.
Nadia Simmons
Forex & Oil Trading Strategist
Przemyslaw Radomski
Founder, Editor-in-chief
Sunshine Profits: Gold & Silver, Forex, Bitcoin, Crude Oil & Stocks
Stay updated: sign up for our free mailing list today
* * * * *
Disclaimer
All essays, research and information found above represent analyses and opinions of Nadia Simmons and Sunshine Profits' associates only. As such, it may prove wrong and be a subject to change without notice. Opinions and analyses were based on data available to authors of respective essays at the time of writing. Although the information provided above is based on careful research and sources that are believed to be accurate, Nadia Simmons and his associates do not guarantee the accuracy or thoroughness of the data or information reported. The opinions published above are neither an offer nor a recommendation to purchase or sell any securities. Nadia Simmons is not a Registered Securities Advisor. By reading Nadia Simmons’ reports you fully agree that he will not be held responsible or liable for any decisions you make regarding any information provided in these reports. Investing, trading and speculation in any financial markets may involve high risk of loss. Nadia Simmons, Sunshine Profits' employees and affiliates as well as members of their families may have a short or long position in any securities, including those mentioned in any of the reports or essays, and may make additional purchases and/or sales of those securities without notice.
© 2005-2022 http://www.MarketOracle.co.uk - The Market Oracle is a FREE Daily Financial Markets Analysis & Forecasting online publication.