


How Stock Investors Could Profit from the Dark Net Pattern That Few Others See
Companies / Investing 2015 May 19, 2015 - 02:13 PM GMTBy: ...

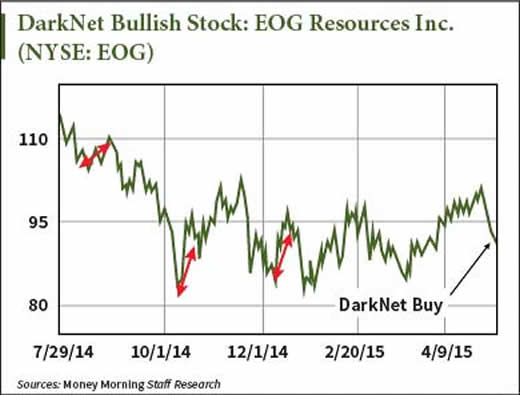
MoneyMorning.com  Tom Gentile writes: In a moment I'm going to show you a chart for EOG Resources Inc. (NYSE: EOG).
As I looked at the chart for this oil and natural gas development company, and positioned myself for a possible trade, an old song happened to come on the radio. It's a catchy tune that my friends and I used to "try" to dance along with.
Fast-forward to today, and as the song plays in my head, I'm almost moved to dance again by the profit pattern I'm seeing develop for us on this chart!
The Pattern That Few Others See… That Will Produce Winners
I call what we see on this chart my "DarkNet Pattern." It's something that only a few of my friends know about. DarkNet is my version of a contrarian system. Now this doesn't mean I am standing on the train tracks reflexively taking the opposite side of any trade. Rather, it means I love the overall direction of a trade, but am buying on pullbacks. That's where DarkNet comes in.
In short, DarkNet analyzes trends. Computers identify these short- and long-term channels every day, and when two or more channels collide, this typically indicates a change in the stock's direction.
Now it's one thing to have a method, but it's something else to be able to back-test it using past data. But we can do precisely that. Let's take another look at the chart and focus on the red arrows. Each of these represents a buy (the low-end) and sell (high-end) point in the past.
Now, let's dig just a bit deeper than the chart above, and get into some of the nitty-gritty of EOG and DarkNet.
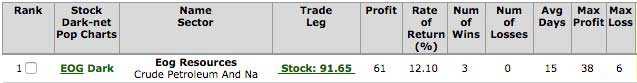
The table above shows not only the current buy that has occurred, but some info on the last three signals. The last three signals generated a profit of roughly $6 per share. The worst drawdown on any of these three trades was again roughly $6, but overall, all three past trades were profitable at an average of just over 12%. Not bad for a readily spotted pattern.
The other interesting piece of news is the average time frame in the trade… 15 days. This is good news regardless of whether you are a stock or options trader. I'll explain why.
Most retail stock traders fall into one of three loose categories:
- Novice: They buy a stock and hope it goes higher.
- Semi Pro: They buy a stock, and have a target and loss projection on it.
- Pro: They buy a stock, and have both price and time targets on it, so as if they were playing a game of financial chess, are thinking ahead of the crowd.
Knowing that we have an average of 15 days in this particular trade is great news because you now have a time target for the trade. This lets you know not only what you may use as price risk, but the average time your money will be tied up, in this case 15 days.
Let's Talk About Making 300% on the Option Trade
The option trader, if he or she were a buyer, already has the stop-loss built in, which is the premium on the option. An option trader can also build in a target for the option based on the trader's target price for the stock, in this case, for EOG. Let's take a look at a recent example:
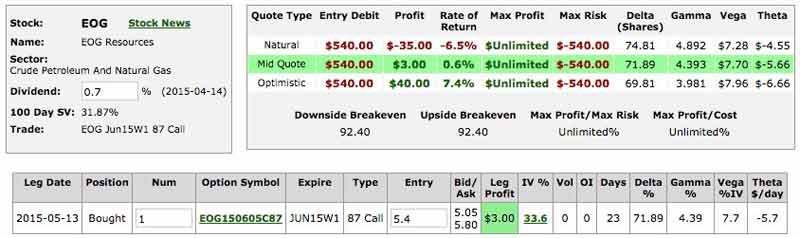
Now this example shows the trader buying a June week 1 87-call option for the price of $5.40. Since each contract controls 100 shares, that means this contract will cost the buyer $540. Also keep in mind the expiration date on the option, in this case, 23 days. This is several days past the 15 day average time in the stock, which is great. So our time target for holding the stock is well within the expiration date of this option.
What about price movement risk?
Well, the biggest downside on this option is if it were to lose all its value, in this case $5.40 or $540 per contract. But how do we determine a target price for the option?
By using the average move in the DarkNet tests… or 12% of the stock price! So, what's 12% of 91? Let's call it 10 points. So based on our current price of $91.77, let's use 102 as our price target.
If we now subtract $87 (the strike price) from $102 (the target price) we get $15. This means our $87 call would have a minimum of 15 points value with the stock price at $102. That's nearly 300% higher than the $5.40 price on entry.
So, I'm ready to move when I see DarkNet patterns develop on stocks like EOG!
Source :http://moneymorning.com/2015/05/19/how-to-profit-from-a-pattern-few-others-see/
Money Morning/The Money Map Report
©2015 Monument Street Publishing. All Rights Reserved. Protected by copyright laws of the United States and international treaties. Any reproduction, copying, or redistribution (electronic or otherwise, including on the world wide web), of content from this website, in whole or in part, is strictly prohibited without the express written permission of Monument Street Publishing. 105 West Monument Street, Baltimore MD 21201, Email: customerservice@moneymorning.com
Disclaimer: Nothing published by Money Morning should be considered personalized investment advice. Although our employees may answer your general customer service questions, they are not licensed under securities laws to address your particular investment situation. No communication by our employees to you should be deemed as personalized investent advice. We expressly forbid our writers from having a financial interest in any security recommended to our readers. All of our employees and agents must wait 24 hours after on-line publication, or after the mailing of printed-only publication prior to following an initial recommendation. Any investments recommended by Money Morning should be made only after consulting with your investment advisor and only after reviewing the prospectus or financial statements of the company.
© 2005-2022 http://www.MarketOracle.co.uk - The Market Oracle is a FREE Daily Financial Markets Analysis & Forecasting online publication.