


Global Stock Market, Commodities Group Analysis
Stock-Markets / Stock Markets 2015 May 19, 2015 - 02:23 PM GMTBy: Tony_Caldaro

 We continue the International indices update with the European indices that made bear market lows in 2012. These three indices were the most severely impacted by the European debt crisis of 2011/2012. While most of Europe was bottoming in 2009, with the US, these three indices only made wave A lows. Then after a B wave rally into 2009/2010 then declined again into 2012 to end their bear markets.
iIBEX
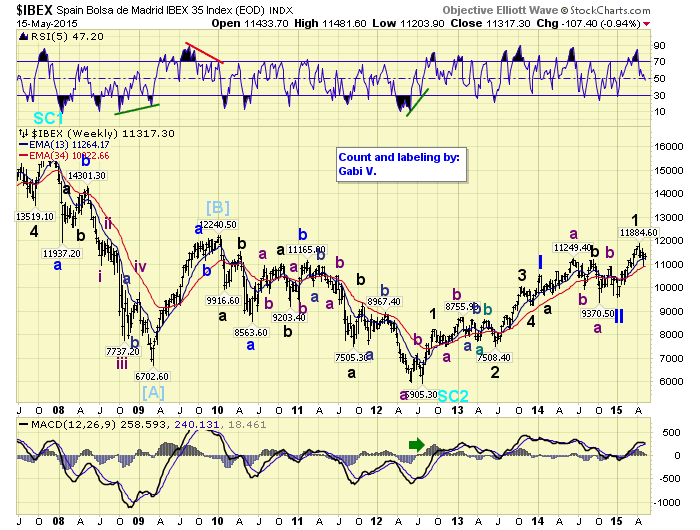
Spain’s IBEX displays a generally choppy pattern since its 2012 low. We have a complex irregular flat for Major wave 2, a simple Major 4, then a Primary I high in early 2014. After that another complex irregular flat for Primary wave II. Since then, with the help of the ECB’s EQE, the IBEX has nearly risen back to its 2010 high, in a Major wave 1 of Primary III. A Major wave 2 correction is underway now. We estimate when this bull market completes the IBEX should be back to its 2007 all time high at 16,040.
iMIB
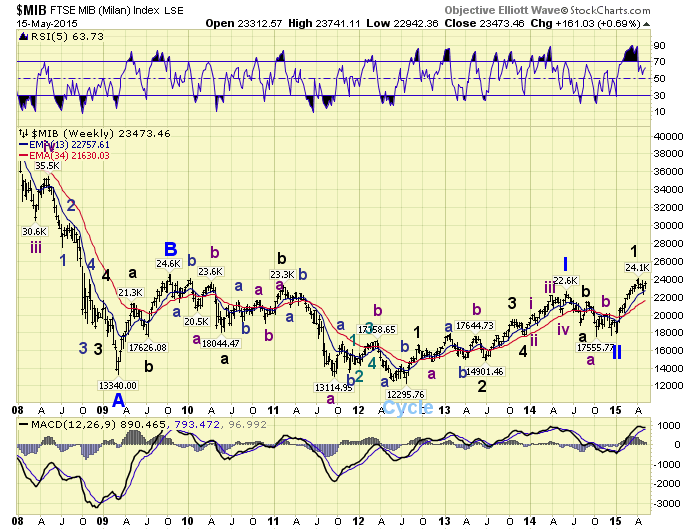
Italy’s MIB displays a less choppy Primary I pattern from its 2012 low. It also had an irregular Major wave 2, and simple Major wave 4. But its Major wave 5 subdivided into five Intermediate waves, before entering a complex Primary II during 2014. Since then its Major wave 1 of Primary III has also spiked higher, completed, and is now in Major wave 2. Unlike Spain its all time high was in 2000 at 51,300, and a second high in 2007 at 44,300. It is still quite a way from even that secondary high. We estimate, however, the 2007 high could be a good target for the current bull market.
iATG
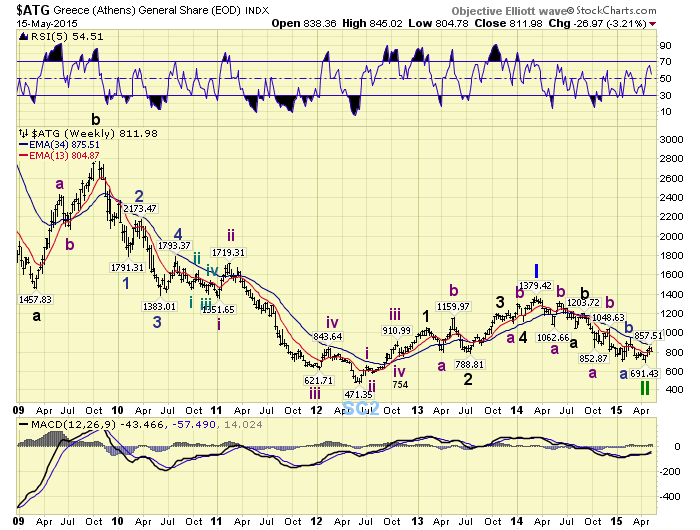
Greece’s ATG also displays a somewhat choppy pattern from its 2012 low. Its Major wave 2 was a large irregular flat, and oddly its Major wave 4 was a smaller irregular flat. Since there is very little alternation between waves 2 and 4 this entire rise might be considered corrective. From the early-2014 high, we labeled Primary I, there has been steady series of declining a-b-c’s, with a potential Primary II low in place. Since Greece has not benefitted from the ECB’s EQE, due to its economic and debt problems. We are less convinced, than at the beginning of the year, that this labeling is correct. With the ATG currently selling at about 10% of its all time high in 2000 at 7420, we prefer to wait until their debt situation is resolved. It appears, from our perspective, their best option is to leave the Euro, but remain in the EU. This would give them control of their own currency, like England and Switzerland, and remain part of the European union.
iTSX
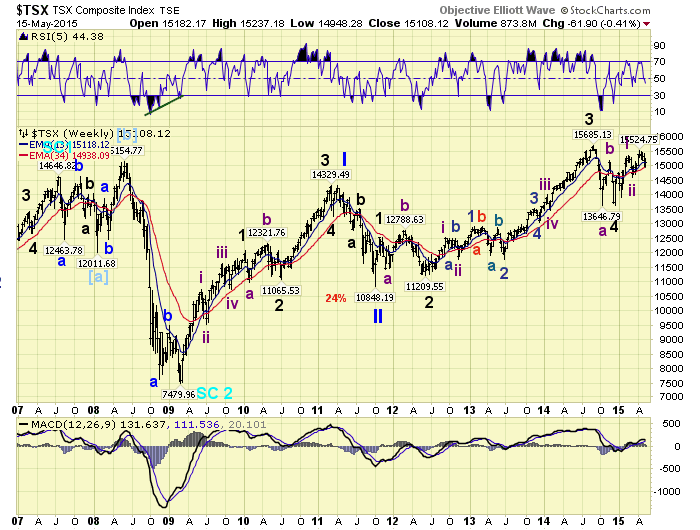
Canada’s TSX is part of what we consider the commodity equity group. This also includes Brazil and Russia. While all three are very sensitive to commodity prices Canada has a fairly extensive banking system that helps offset some of the cyclicality of commodities. The TSX bear market bottomed in 2009, had Primary waves I and II in 2011, and has been in Primary III since then. Its Primary III pattern was also a bit choppy until mid-2013, when it started impulsing higher. It currently appears to be in Intermediate wave iii of Major wave 5. However, just like the FTSE, the current uptrend may only be a b wave of a complex Intermediate wave ii. We could project a high of about 17,600 for Primary III, where III equals I.
iBVSP
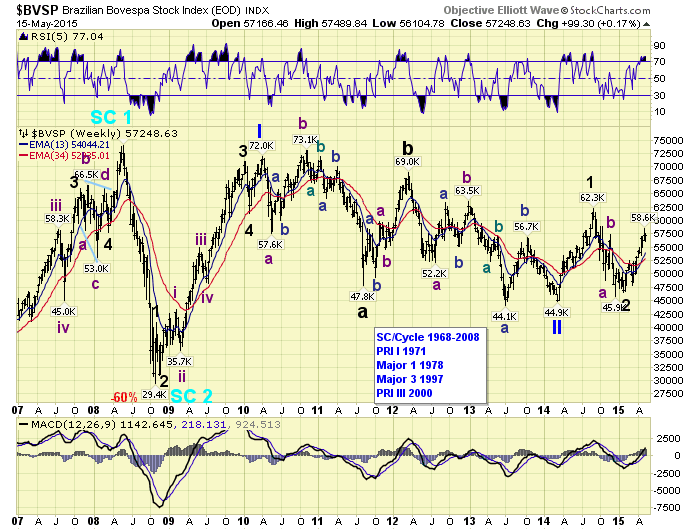
Brazil’s BVSP has had quite a volatile run since its all time high at 73,900 in 2007. A commodity bear market, political scandals and currency gyrations have contributed to this volatility. After making a bear market low in 2008 the BVSP completed a Primary wave I in 2010. Then it went into a four year bear market, which appears to have bottomed in early-2014. Since that low it has had a very strong Major wave 1, a huge retracement for Major wave 2, and since early-2015 a big rally to start Major wave 3. The current uptrend may only be Intermediate wave i of Major 3. Should our count be correct the BVSP should easily exceed all time highs before Primary III ends.
iRTSI
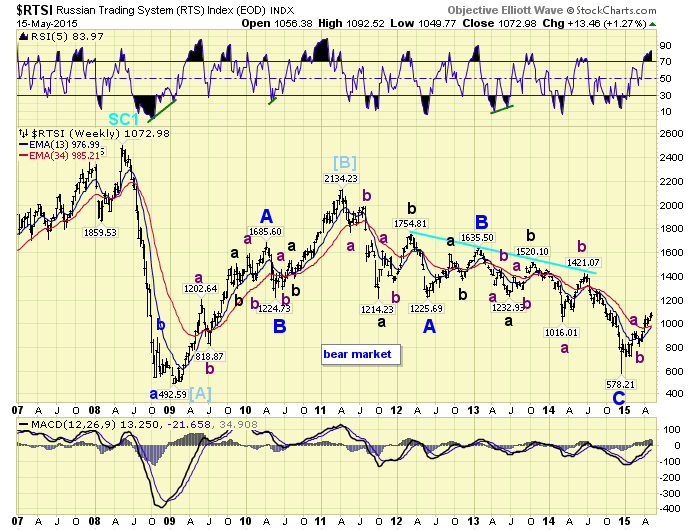
Russia’s RTSI is an index that is quite levered to energy and geopolitical events. Unless one understands where it is in its long term trend, investing in it is much akin to playing Russian roulette. When one compares this chart to Crude oil they look quite similar. Except the RTSI rose from about 40 in 1998 to 2500 by 2008, while Crude rose from $10 to $150 during the same period. After that all time high at 2500 in 2008, the RTSI dropped to around 500 by 2009. That low appears to be only part of a large ongoing bear market. Then the RTSI rallied, in an a-b-c, to 2100 by 2011 to complete a Cycle B wave. After that it plunged again, in an a-b-c, to the recent low near 700. We are labeling this entire decline from 2011 as Primary waves A-B-C. Since that low we are now anticipating a choppy X wave advance, just like Crude, for the next couple of years. After that completes we expect, eventually, a revisit to the 2014 low, and even the 2009 low, and lower, before this multi-year bear market concludes. This is a very risky index for the average investor.
You can follow all the International indices on pages 5 – 8 using this link: http://stockcharts.com/public/1269446/tenpp/5
http://caldaroew.spaces.live.com
After about 40 years of investing in the markets one learns that the markets are constantly changing, not only in price, but in what drives the markets. In the 1960s, the Nifty Fifty were the leaders of the stock market. In the 1970s, stock selection using Technical Analysis was important, as the market stayed with a trading range for the entire decade. In the 1980s, the market finally broke out of it doldrums, as the DOW broke through 1100 in 1982, and launched the greatest bull market on record.
Sharing is an important aspect of a life. Over 100 people have joined our group, from all walks of life, covering twenty three countries across the globe. It's been the most fun I have ever had in the market. Sharing uncommon knowledge, with investors. In hope of aiding them in finding their financial independence.
Copyright © 2015 Tony Caldaro - All Rights Reserved Disclaimer: The above is a matter of opinion provided for general information purposes only and is not intended as investment advice. Information and analysis above are derived from sources and utilising methods believed to be reliable, but we cannot accept responsibility for any losses you may incur as a result of this analysis. Individuals should consult with their personal financial advisors.
Tony Caldaro Archive |
© 2005-2022 http://www.MarketOracle.co.uk - The Market Oracle is a FREE Daily Financial Markets Analysis & Forecasting online publication.