


Stock Market Sell in May and Go Away?
Stock-Markets / Stock Markets 2015 May 20, 2015 - 12:33 PM GMTBy: Clif_Droke

 The theme of "bad news is good news" continues as several economic reports weighed on investor sentiment. Recent reports have been disappointing, but this has also served to bolster investors' belief that the Fed will respond to the weak data by passing on an interest rate increase.
A Wall Street bromide tells investors to "sell in May and go away." The rationale behind this adage is that the stock market historically posts its best performance between the months of October and April. According to Stock Trader's Almanac, "A $10,000 investment compounded to $578,413 for November-April in 57 years compared to a $341 gain for May-October." While May-October period is statistically less impressive in terms of overall percentage gains in most years, this isn't always the case. It should also be noted that the "sell in May" aphorism is deceptive; indeed, some of the most impressive market rallies of the last 20 years have occurred in the summer months.
According to our friends at Stock Trader's Almanac, the period between May and June was a "disaster area" between 1965 and 1984 with the SPX down 15 out of 20 Mays. However, between 1985 and 1997 May was the best month with 13 consecutive gains, gaining 3.3% per year on average. Since then the record has been volatile with a mixture of up and down Mays.
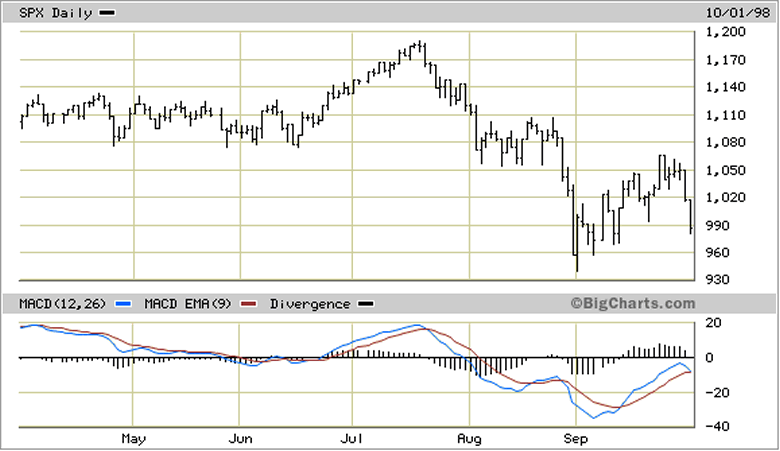
The reason why the May-September period tends to be weak compared to the October-April period is that interspersed between the impressive summer rallies are periods of sometimes wild volatility. The classic case in point is 1998, which witnessed a meteoric rally in June-July before a nasty spill in August-September. A more recent example would be the June 2007 rally to new highs in the SPX which was followed by a harrowing sell-off in July-August.
With that said, are there reasons for believing that this year's May-October period will break the mold of underwhelming stock market returns? Yes there are, and the biggest reason is that this is the phenomenal "Year Five" of the decade. The fifth year of the decade has historically always been a winner for stocks and the reason is simple: the 10-year cycle always bottoms late in the fourth year. The subsequent lifting pressure in the following year virtually guarantees a buoyant stock market, which accounts for the winning tendency of the fifth year.
This time around there is the added benefit of several longer-term yearly cycles also having bottomed late last year, which means those cycles are now in the up phase in 2015. This is one reason why stocks have stubbornly refused to decline in a meaningful fashion so far this year. There's simply too much of a cyclical upside bias, which in turn has counteracted the negative U.S. and global economic developments this year.
There are also other reasons for believing that we could witness a surprising rally at some point in the coming months. Consumers have been adding to their savings stash this year. Economists assumed at the start of 2015 that plunging oil and gasoline prices from late 2014/early 2015 would stimulate a consumer buying binge due to the savings in energy costs. But instead of spending the fuel cost savings, consumers funneled that extra money into their piggy banks. This creates a rather substantial reservoir of fuel for a future spending binge. Consumers tend to oscillate wildly between overspending and over-saving. When they go too far to one extreme, the pendulum goes in the opposite direction. When consumers are convinced that the fears of a global economic slowdown are overblown, they'll eventually emerge from their shells and start spending and investing again.
The fifth year of the decade tends to follow the same basic script each time, and this year (to date) has been no exception. While the stock market tends to outperform in the fifth year, consumer spending tends to be subdued and the economy sometimes even skirts recession (without actually entering it). That script is being played out again in 2015, but as with previous fifth years the cautious attitude of consumers and investors turns to optimism when they realize their fears are without merit. The stock market is telling us that despite the economic potholes here and there, the 6-year recovery trend remains very much intact.
Mastering Moving Averages
The moving average is one of the most versatile of all trading tools and should be a part of every investor's arsenal. Far more than a simple trend line, it's also a dynamic momentum indicator as well as a means of identifying support and resistance across variable time frames. It can also be used in place of an overbought/oversold oscillator when used in relationship to the price of the stock or ETF you're trading in.
In my latest book, Mastering Moving Averages, I remove the mystique behind stock and ETF trading and reveal a simple and reliable system that allows retail traders to profit from both up and down moves in the market. The trading techniques discussed in the book have been carefully calibrated to match today's fast-moving and sometimes volatile market environment. If you're interested in moving average trading techniques, you'll want to read this book.
Order today and receive an autographed copy along with a copy of the book, The Best Strategies for Momentum Traders. Your order also includes a FREE 1-month trial subscription to the Momentum Strategies Report newsletter: http://www.clifdroke.com/books/masteringma.html
By Clif Droke
www.clifdroke.com
Clif Droke is the editor of the daily Gold & Silver Stock Report. Published daily since 2002, the report provides forecasts and analysis of the leading gold, silver, uranium and energy stocks from a short-term technical standpoint. He is also the author of numerous books, including 'How to Read Chart Patterns for Greater Profits.' For more information visit www.clifdroke.com
Clif Droke Archive |
© 2005-2022 http://www.MarketOracle.co.uk - The Market Oracle is a FREE Daily Financial Markets Analysis & Forecasting online publication.