


US Stock Markets Weakening Earnings Growth Fundamentals
Stock-Markets / Stock Market Valuations Jun 18, 2008 - 11:56 AM GMT

 “Most of the time common stocks are subject to irrational and excessive price fluctuations in both directions as the consequence of the ingrained tendency of most people to speculate or gamble … to give way to hope, fear and greed,” said Benjamin Graham (co-author with David Dodd of Security Analysis, 1934 – considered by many to be the bible of value investing).
But how does one gauge whether stocks, or in this case the US stock market as a whole, are over- or undervalued? In a post ( Stock Markets: Up, Down, Sideways? ) last week I attempted to analyse the situation by means of a few price charts and contrarian indicators. This is a follow-up, focusing more on some fundamental aspects.
As a point of departure, it is notoriously difficult to put numbers to US corporate earnings growth in the present troubled economic climate. Matters are further complicated by the sub-prime-related write-downs.
The graph below shows that earnings growth of the S&P 500 Index declined by 25.3% compared with a year ago. Incidentally, the average annual earnings growth since 1955 has been 8.0%.
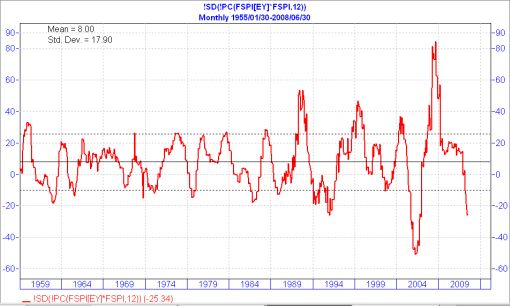
Source: Plexus Asset Management and I-Net Bridge
A shrinking economy bodes ill for corporate earnings and current indications are that the S&P 500 Index's earnings could be down by as much as 30% to 40% in year-ago terms by the end of the second quarter this year. This is gleaned from the historical relationship between the US Purchasing Managers Index (PMI) and the S&P 500 Index's earnings growth, as shown in the graph below.
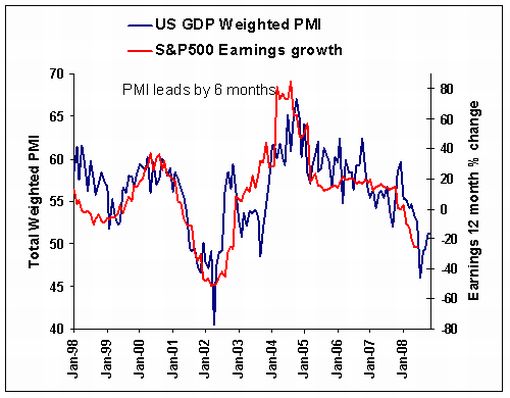
Source: Plexus Asset Management and I-Net Bridge
Trying to get a grip on forecast earnings is very difficult. Birinyi Associates estimates the S&P 500 Index's 12-month growth at 49.5%, and the IBES numbers of 50.7% through Q2 2009 concur.
My hunch is that these S&P estimates are probably on the optimistic side, especially with US profit margins looking set to shrink further as the economic woes drag on and rising costs make further inroads into profits. At least, the following graph seems to indicate that mean reversion of profit margins has not yet run its course.
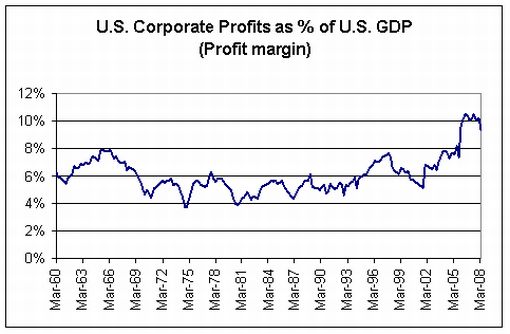
Source: Plexus Asset Management and I-Net Bridge
At current earnings levels the S&P Index 500 Index is trading at a price-earnings ratio (PER) of 21.9 (based on as-reported earnings). This level does not appear particularly cheap when simply considering historical PER averages of 17.1 over 53 years and 22.8 over 10 years.
The key to assessing valuation levels, however, is to get a grip on the forward numbers. The Birinyi earnings estimate translates into a forward PER of 14.6. On the face of it (and if 50% earnings growth materializes), this looks more attractive but let's dig a bit deeper in order to make sense of the figures.
The so-called “Fed Model” attempts to value stocks relative to bonds and simply states that the real yield of US 10-year Treasury Note should correspond to the S&P 500 Index's earnings yield (i.e. 12-month forward earnings divided by the current index).
Given the current yield on Treasuries of 4.21%, this model equates to a forward PER of 23.8%. If Birinyi's earnings hit the mark, this (rather imperfect) model suggests that stocks are cheap relative to bonds.
But, is it correct to blindly use 10-year Treasuries as the “risk-less benchmark”? Bennet Sedacca, well-respected president of Atlantic Advisors , argues that one should use the Ginnie Mae (GNMA) pools with the best overall risk profile as the “risk-less benchmark” to see whether stocks are cheap or not.
GNMA 6% pools are currently yielding 6.00% and have a duration of only 4.15 years – considerably less than the current 8.31-year duration of the 10-year Note. In other words, one is able to earn 1.79% more per year with half of the volatility and still maintain a zero credit risk profile. This translates to a PER of 16.7, arguing that stocks are also a better bet than GNMAs (at least based on the Birinyi estimate).
But this is where it becomes interesting and where one must factor in a risk premium. Adding 2.5% and 7.5% (Sedacca's preference) risk premiums to the GNMA yield, implies PERs of 11.7 and 7.4 respectively. This tells a totally different story, rendering stocks expensive even with forecast 12-month earnings growth of about 50%.
Sedacca provides a neat summary table, which is reproduced below (adjusted for the Birinyi numbers and current levels).
| POTENTIAL PRICE TARGETS FOR S&P 500 INDEX | |||
| Index levels (current: 1,351) | |||
| Risk-free equivalent | Implied P/E (current: 21.9) | Based on 49.5% earnings growth*: $92.3 |
Based on 0% earnings growth: $61.7 |
| Fed Model: US 10-year Treasuries: 4.21% yield | 23.8 |
2,196 |
1,468 |
| GNMA 6%: 6.0% yield | 16.7 |
1,541 |
1,030 |
| GNMA +2.5% risk premium: 8.5% | 11.7 |
1,080 |
722 |
| GNMA +7.5% risk premium: 13.5% | 7.4 |
683 |
457 |
* Birinyi Associates
In order to get a better feel for the numbers, let's consider the Plexus Valuation Calculator. The diagram is an easy way of determining the expected returns of the S&P 500 Index for different combinations of corporate earnings growth and PERs.
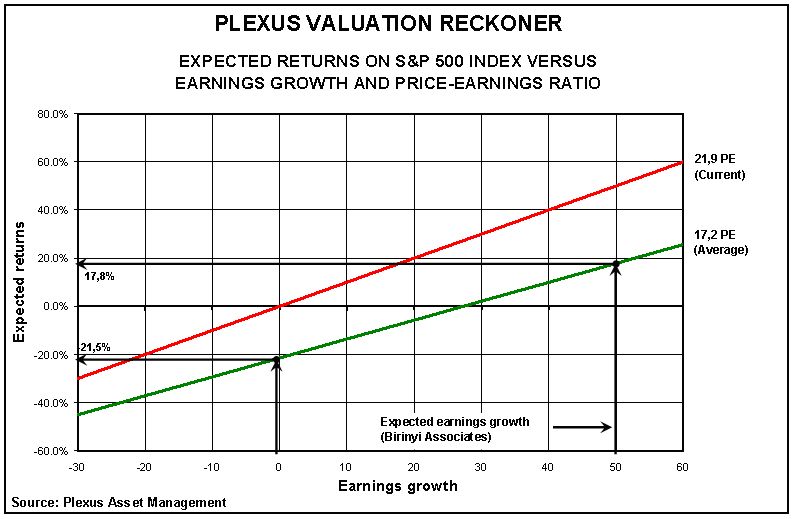
The diagram shows that if the Birinyi numbers turn out to be correct and the PER compresses to the long-term average of 17.2, investors could expect a return of 17.8% on their investment over the year. But what happens when the there is less earnings growth and the PER falls to, or below, the long-term average? Not a pretty picture!
Playing around with various combinations of earnings growth and PERs makes for interesting reading. But, more so, it also makes it hard for me to find compelling value when considering the US stock market as a whole.
Lastly, my colleagues at Plexus Asset Management have produced a multi-year comparison of the PER of the S&P 500 Index and the forward real returns. The research covered the period from 1871 to February 2008 and used the S&P 500 Index (and its predecessors prior to 1957). In essence, a total real return index and coinciding 10-year forward real returns were calculated and used together with PERs based on rolling average 10-year earnings. The PERs and the 10-year forward real returns were then grouped in five quintiles (i.e. 20% intervals), showing clearly the strong long-term relationship between real returns and the level of valuation at which the investment was made.
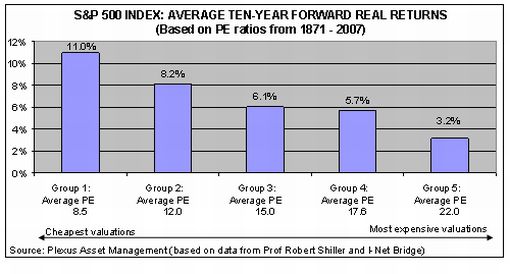
Based on the above research findings, with the S&P 500 Index's current 10-year normalized PER of 23.5, investors should be aware of the fact that the market is by historical standards not in cheap territory, arguing for luke-warm long-term returns.
Although this post offers no guidance as to calling market tops and bottoms, it does indicate that it would be irrational to bank on above-average returns from these valuation levels. A muddle-through outlook seems to be what the US stock market has in store. That's the way it looks from here.
Did you enjoy this posting? If so, click here to subscribe to updates to Investment Postcards from Cape Town by e-mail.
By Dr Prieur du Plessis
Dr Prieur du Plessis is an investment professional with 25 years' experience in investment research and portfolio management.
More than 1200 of his articles on investment-related topics have been published in various regular newspaper, journal and Internet columns (including his blog, Investment Postcards from Cape Town : www.investmentpostcards.com ). He has also published a book, Financial Basics: Investment.
Prieur is chairman and principal shareholder of South African-based Plexus Asset Management , which he founded in 1995. The group conducts investment management, investment consulting, private equity and real estate activities in South Africa and other African countries.
Plexus is the South African partner of John Mauldin , Dallas-based author of the popular Thoughts from the Frontline newsletter, and also has an exclusive licensing agreement with California-based Research Affiliates for managing and distributing its enhanced Fundamental Index™ methodology in the Pan-African area.
Prieur is 53 years old and live with his wife, television producer and presenter Isabel Verwey, and two children in Cape Town , South Africa . His leisure activities include long-distance running, traveling, reading and motor-cycling.
Copyright © 2008 by Prieur du Plessis - All rights reserved.
Disclaimer: The above is a matter of opinion and is not intended as investment advice. Information and analysis above are derived from sources and utilizing methods believed reliable, but we cannot accept responsibility for any trading losses you may incur as a result of this analysis. Do your own due diligence.
Prieur du Plessis Archive |
© 2005-2022 http://www.MarketOracle.co.uk - The Market Oracle is a FREE Daily Financial Markets Analysis & Forecasting online publication.