


U.S. Crude Oil Glut An EIA Invention?
Commodities / Crude Oil Jun 29, 2015 - 05:29 PM GMTBy: OilPrice_Com
 In the latest weekly production data from the EIA, on the back of recent March revisions, the U.S. managed to post a 76,000 barrel per day increase in the lower 48. Production from Alaska fell by 61,000 barrels per day, putting overall U.S. output 15,000 barrels per day higher for the week ending June 12 compared to the previous week.
This comes at a time when multimillion barrel draws have become the norm. It is important to note that lower 48 production is estimated based on an EIA black box model, while Alaska is virtually real time data. That suggests that the weekly supply estimates are hugely overestimated.
These weekly supply numbers are then used as a basis to jump to the conclusion that the markets are suffering from too much supply. As stated on OilPrice.com many times before, the amount of "over supply" vs. the averages in the U.S. according to the EIA amounts to tens of millions of barrels of oil.
I continue to maintain that the EIA revision to production came very suspiciously at exactly the same time inventory draws began, as did the "Miscellaneous to Balance" figure used in calculating inventory. The chart below clearly shows when this figure started to grow and by what amount. It totals more than 30 million barrels since April and has been rising, which is virtually all of the oversupply above the mean in the U.S! To reiterate that number is at discretion of the EIA and is not an actual data point but an "adjustment."
Data Errors Have Real World Consequences
This figure, as created by the EIA, has (with the media's help) created the impression of a huge oil glut in the U.S. market. No one, either within the media or the industry, has asked for clarification of this number and it is instead taken as gospel. This is now wreaking havoc in energy states such as Texas, as well as threatening most oil companies as well as tens of thousands employed within the oil and gas industry. With such importance placed on a number which has impacted not only billions of dollars in company revenue but many lives for the worse, how can it be largely unchallenged by all but a few in the media?
Whether this is tied to sheer incompetence or some other, more sinister reason, the number should be as accurate as possible. The consistent errors put the vast majority of small E&P companies at risk. The EIA, at its sole discretion, has had the power the dramatically affect the sentiment and prices of an entire industry and in some cases completely obliterate it. The magnitude of the errors is mounting by the day as are the consequences.
Natural Gas
On a separate note, one has to wonder about the goings on with natural gas prices given that they are holding at only 10 percent above their yearly lows. Stocks, as reported this morning, are still healthy at 1.4 percent above their 5 year average but this number may be a bit misleading. Demand tied to coal switching is quite frankly soaring and is at record highs. To reiterate, this comes at a time when natural gas production is poised to decline. One of the largest natural gas producers in the U.S., Chesapeake Energy, is expected to start seeing 5 percent declines in 2016 production according to UBS, as Free Cash Flow (FCF) continues to be hugely negative at nearly $3 billion through 2016 as debt/EBITDAX (Earnings Before Interest, Taxes, Depreciation, Depletion, Amortization and Exploration Expenses) soars to over 5X. This comes as hedges roll off in 2016. With FCF being negative throughout the group, the problem starts to look like a serious issue. There will come a day of reckoning when capital expenditures dry up as demand continues and the data distortions on estimates finally become clear to the markets. It won't be pretty for prices down the road and it will come as a result of capital budgets getting slashed based on artificially depressed prices. When this occurs everyone should re-read this article as I'm sure the cries from soaring prices will become very loud. The E&P space won't be the cause but the victim in all this. Data distortion by government agencies has serious consequences on capital investments.
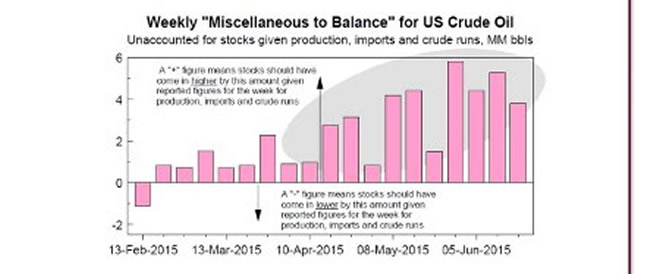
Image source: Cornerstone Analytics
Source: http://oilprice.com/Energy/Energy-General/US-Oil-Glut-An-EIA-Invention.html
By Leonard Brecken for Oilprice.com
© 2015 Copyright OilPrice.com - All Rights Reserved
Disclaimer: The above is a matter of opinion provided for general information purposes only and is not intended as investment advice. Information and analysis above are derived from sources and utilising methods believed to be reliable, but we cannot accept responsibility for any losses you may incur as a result of this analysis. Individuals should consult with their personal financial advisors.
OilPrice.com Archive |
© 2005-2022 http://www.MarketOracle.co.uk - The Market Oracle is a FREE Daily Financial Markets Analysis & Forecasting online publication.