


Agricultural Commodities Peak Food
Commodities / Food Crisis Aug 11, 2015 - 08:33 AM GMTBy: Ned_W_Schmidt

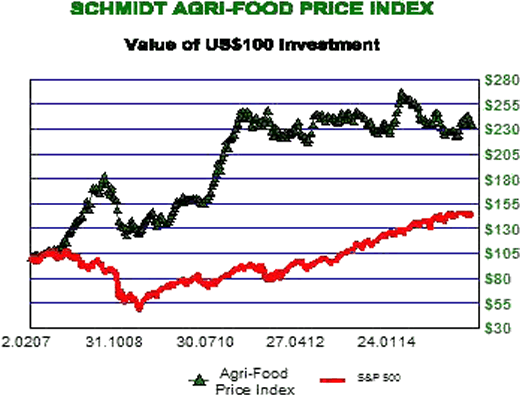
 Last we visited on Agri-Foods the concept of Peak Food was introduced. That shift in the fundamentals of global food production was identified as adding support to Agri-Commodity prices. For despite the negative sentiment on commodities and "China is collapsing" group think, Agri- Commodity prices continue to show strong resilience, as shown in the chart below right. As prices of Agri-Commodities do not move in unison, the Agri-Food Price Index has been essentially unchanged for about three years. For example, recently hog prices have been weak while U.S. cash corn hit a new 52-week high.
In recent times the "China is collapsing" view has become a popular theme. Despite that thinking, Agri-Commodity prices are down less than 3%, on average, in the past four weeks. After taking into consideration seasonal factors, the price response to the popular views on China's economy has been tiny. Reason for that is Chinese imports of grains have been exceptionally strong, up more than 60% from a year ago through end of June.
Peak Food was the name given to the results of research by Seppelt, et al(2014) published as "Synchronized peak-rate years of global resources use" in Journal of Ecology and Society. That research was made popular in "Have we reached 'peak food'? Shortages loom as global production rates slow" (Bawden,2015). For that reason we credit Bawden with the term Peak Food.
In their research Seppelt, et al studied the long-term production records of 27 renewable and non renewable resources. Our interest is primarily with the Agri-Foods they studied, which are classified as renewable resources. 17 Agri-Commodities were studied, from cotton to corn to rice and soybeans. Included were the bulk of the Agri-Commodities that feed the world.
Focus of that research was on the year-to-year change of production of these commodities. What they discovered was that the annual gain, or increase, of production for most of those Agri-Commodities had peaked. Of the 17 Agri-Commodities studied, 16 had Peak Years in the time frame 1985-2009. Production of those Agri-Commodities is rising, but the rate of increase is slowing. That reality has strong implications for future Agri-Commodity prices as demand continues to rise.
Let us explore for a minute the implications of Peak Food from Seppelt, et al. Focus was on the year-to-year production change for the commodities. Below is a stylized chart, meaning that it paints the picture rather than portrays specific data, of the trend in annual global production change, green bars. This research concluded that the most likely year of maximum production gain for corn, as one example, occurred in 1985. Up to that year the annual gains in production were rising, and since then have generally been smaller each year.
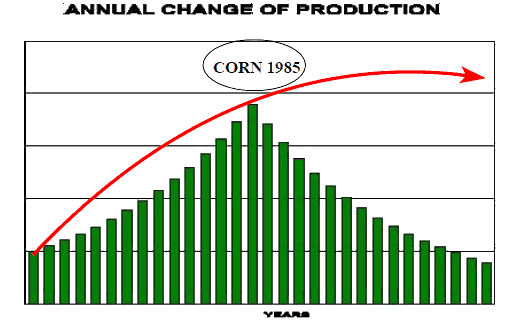
Red arrow approximates what the total global production curve would look like given the shape of the green bars. Total corn production continues to rise, but at a much slower rate. That happens as each year's potential increase of production becomes smaller, and we might add more expensive. When total production is as the red curve depicts, the sensitivity of prices to an increase in demand is higher. Price of corn should rise over time by a greater percentage than does annual production.
This analysis says nothing about what can happen in any one country or region in a particular year. For example, North American corn harvest was especially good in 2013 and 2014. That was due to the weather rather than a change in the longer term picture. As evidence of that we note that U.S. cash corn price in the U.S. is less than $4/bushel while at the same the dollar equivalent price in China is more than $9/bushel. Further, note that U.S. cash corn recently made a new 52-week high.
In the above discussion we implied a precision in the estimate for corn's peak year with which we should be careful. Based on the research, 1985 is the most likely peak year. In statistical terms that means it is the best estimate, and that the probability of a later year or an earlier year is 50%.
In table below we provide the estimates of peak years from Seppelt, et al for the major Agri- Commodities. Most likely peak year for each is in middle column. Final column is what might be described as potentially the latest possible year for the peak. Probability that Peak Year is later than the last column is 2.5%. For our purposes this means that we can have considerable confidence, 97.5%,that the Peak Year for corn production was before 2007, third column, and most likely between 1985 and 2007.
So, what does this all mean? First, each year in the future increasing global production of food will become more difficult. Second, rising global demand means that prices are going higher. Third, onlywayannual production gains can be increased is byrasing prices to perhaps unacceptable levels. China has sustained corn production only through high prices, above $9/bushel and more than twice those of the U.S. Fourth, how will world feed India? Indian food consumption has the potential to "double" in the next decade. Fifth, Agri-Equities, shares of those companies involved in Agri- Food production, should benefit in a significant manner from this situation.
References:
Bawden, T. (28 January 2015).Have we reached 'peak food'? Shortages loom as global production rates slow. The Independent.
Malthus, T. (1798). An Essay on the Principle of Population. Amazon Kindle.
Seppelt, R., et al. (December,2014). Synchronized peak-rate years of global resources use. Journal of Ecology and Society.
Ned W. Schmidt,CFA is publisher of The Agri-Food Value View, a monthly exploration of the Agri-Food Super Cycle, and The Value View Gold Report, a monthly analysis of the true alternative currency. To contract Ned or to learn more, use either of these links: www.agrifoodvalueview.com or www.valueviewgoldreport.com
Ned W Schmidt Archive |
© 2005-2022 http://www.MarketOracle.co.uk - The Market Oracle is a FREE Daily Financial Markets Analysis & Forecasting online publication.