


Tracking Stock Market Investor Sentiment with Credit Spreads
Stock-Markets / Stock Markets 2015 Sep 06, 2015 - 04:16 PM GMTBy: Dan_Norcini

 Long time readers of this site are aware that successful traders/investors learn how to read market sentiment. Positioning yourself on the correct side of a market is the key to profits. Do this, and do it consistently, and you will make money. Don’t do this and you will lose money. It is a very simple yet very profound axiom that sadly many seem never to learn.
“Fighting the tape”, is the expression we use when characterizing those who fail to approach markets objectively, but who insist on reading their own bias or belief system INTO a market rather than listening to what the market is saying to them.
As a side note – This is the chief characteristic of those to whom I often refer to as the “gold cult”. They are so blindly wedded to a belief system, that almost nothing can dissuade them from their rigid ideology. In their “church”, gold must always rise and the world economy must always collapse and when both do not, it is only a matter of waiting long enough for when both eventually will. Most of us sadly have only one short lifetime to get it right so we do not have the luxury of waiting out decades of history while we wait for our boat to come in someday.
When the price of the precious metals rise, they of course look like brilliant geniuses and are not shy about telling anyone the same. More often than not however they appear to be akin to blind hogs wallowing for acorns. Occasionally, they find one but usually they go hungry. They are Johnny one-notes, unable to see the markets for what they are, and while that may make for good camaraderie amongst themselves as they continue preaching to their own choirs, it is unfortunately not a recipe for good profits or a healthy return on investment. Just look at a long term chart of the HUI if you have any doubts about that.
Enough of that however; let’s get back to something of substance. The biggest difficulty that I am having as a trader at this time, and I suspect there are more than a few of the readers out there who feel the same, is trying to ferret out exactly what the current sentiment is out there in the investment world.
No one is really sure what is coming next and whether or not growth is improving or is worsening. It is this lack of conviction that is the source of all the confusion and uncertainty that currently exists in the markets. The lack of conviction is why the markets have been so petulant and ill-behaved of late. In other words, traders and investors are trying to find a trend and are having difficulty in so doing.
Are domestic growth prospects really improving? For that matter, how about global growth prospects? Is a slowing China threatening to drag the rest of the world into a period of anemic growth or are developed countries somewhat insulated from such? Are Central Bank policies of near zero interest rates sufficient to enable true growth during a period of falling commodity prices? Can growth in one or two or even more sectors offset the negatives in other sectors?
These are just a few of the questions that so many investors and traders who are looking to make intelligent and informed decisions are grapping with. The sad truth is that none of us really know for sure.
It is this indecisiveness that makes reading sentiment so extremely difficult at the moment and which therefore makes positioning oneself correctly so challenging.
About the best we can do is to therefore try to stay atop shifts in sentiment, which while they can come quickly and fade just as quickly, will hopefully, at the very least, prevent us from being lopsidedly on the wrong side of an investment or trade.
In doing that, I have tended to try to rely heavily more on the action of the interest rate markets more so than the stock markets. That is why I track the TIPS spread to see whether it is widening out or contracting and the Yield Curve to see whether it is steepening or flattening. I feel these things are a much better reflection of what some of the largest, and smartest players are anticipating than just the level of the stock markets.
One area I am looking at closely, ever since recommending that inverse high yield bond fund ETF, “SJB”, a while back, is the price action of the corporate bond market especially as it is compared to the yields of Treasuries.
As a general rule of thumb, during periods in which investors are expecting growth and thus higher rates, bond prices most often slump since those who issue them are required to pay higher yields in order to compete with riskier assets, such as equities, where investors opt to place risk capital. It becomes a matter of competition among those looking to attract capital – they must provide a higher yield to potential investors in order to compete for that limited pool of investment money. You have to make your item more attractive for buyers and you do this by offering them a higher rate of return than they might otherwise might have gotten for that same item some months ago.
In the case of bonds, this means you discount the price of the bond, which is essentially how we get the higher yield. I realize this is a bit simplistic way of explaining coupons and discounts and what have you, but for investment purposes, it helps me to better understand it since it is simple – after all, most of us want “simple”.
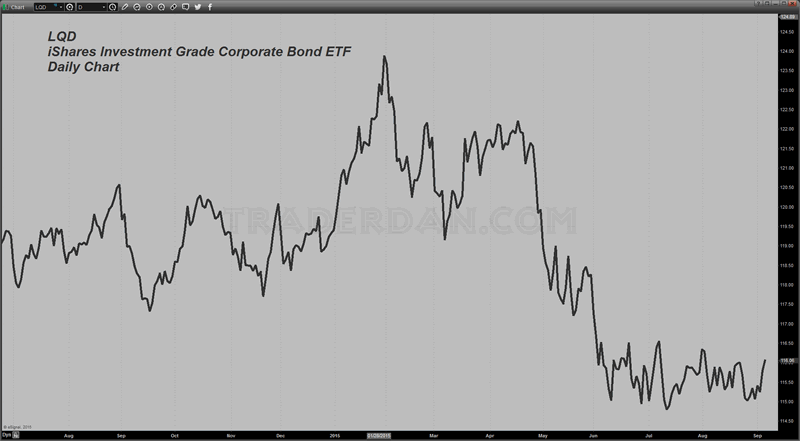
Bearing this in mind, consider the following ETF from Ishares, “LQD”. This is an ETF of Investment Grade Corporate Bonds. The bulk of the bonds are in the 3-10 duration range which a bit more than 25% of their holdings situated in the 20+ year range. All of these bonds are “BBB” rated or higher. Thus this is not considered a junk bond fund.
Now consider the next ETF, “VGIT”. This is Vanguard’s Intermediate Term Government Bond which contains US government debt with maturities of 3-10 years. It consists mainly of Treasuries but does include some US Agency debt as well.
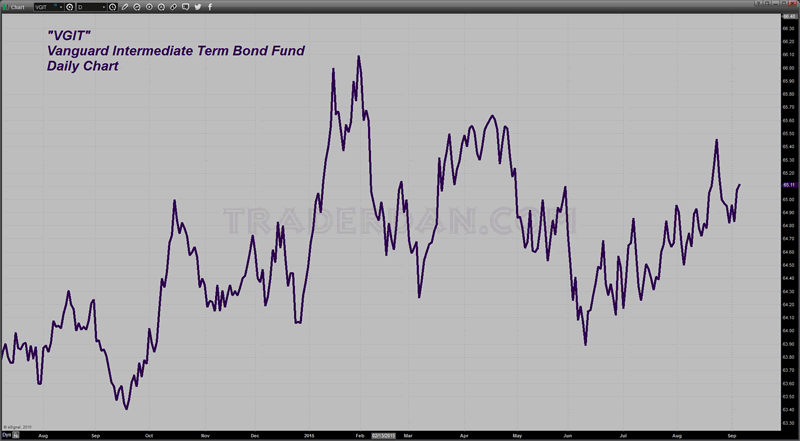
The first of these two bond ETF’s, “LQD” is regarded as a bit more “risky” than the latter, “VGIT”. The reason is the same as it always has been; most investors see US Treasury debt as essentially risk free.
Corporations issuing debt understand these things and therefore must offer bond investors higher yields if they are to attract their money away from Treasuries.
It is my view that during periods in which investors are concerned about future economic growth prospects, they will reach for the safety of US Treasuries more so than even higher grade corporate bonds, because they are searching primarily for safety. If inflation prospects are low, they will also feel more comfortable owning corporate bonds but the desire for safety supercedes the desire for higher yields.
That resultant rush for safety into Treasuries tends to push the price of those higher at a faster pace than the rate at which the price of corporate bonds might tend to rise.
Oftentimes, by measuring the SPREAD between the price of corporate bonds and the price of Treasuries, we can get a sense of where investor priority lies. Some folks will call this a “CREDIT SPREAD” although they are using the actual yields.
In this situation however, I am using the price of the two ETF’s and not the yield. Remember, as bond prices move higher, YIELDS FALL.
One is measuring the difference between yields on high grade corporate bonds and the yields on Treasuries of equal maturity duration and looking to see which direction those are going and whether or not a trend is visible.
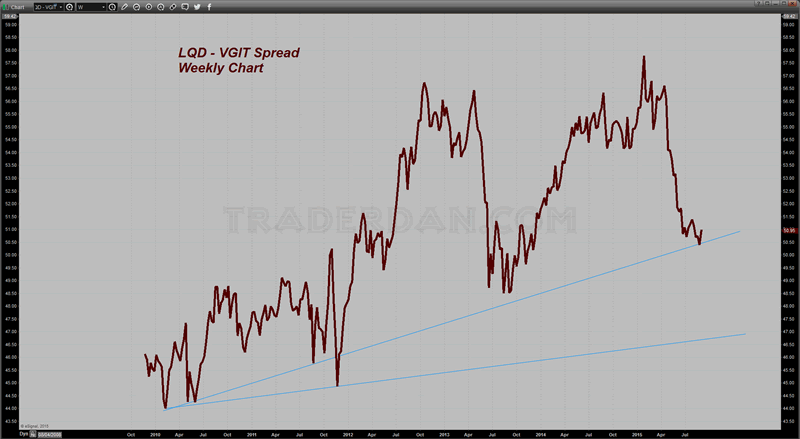
Bearing all this in mind, here is a chart showing the spread in price between the two:
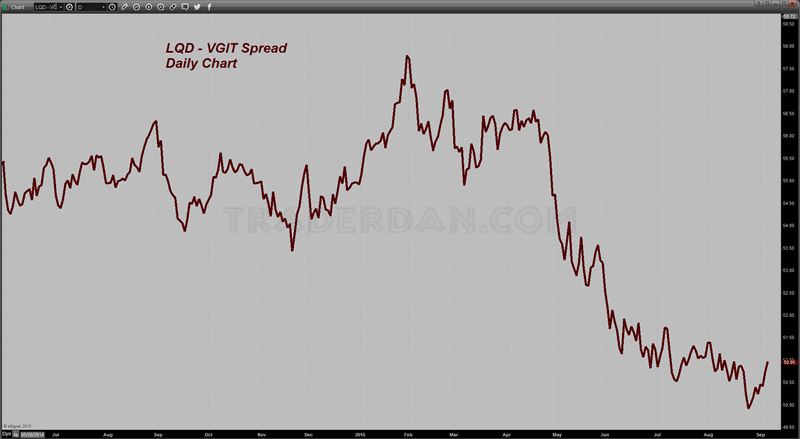
There is definitely a discernible trend is there not? Notice that the price of LQD has been steadily losing ground against the price of VGIT since February of this year. Since yield moves inversely to price this is telling us that the yields on corporate bonds have been rising relative to the yield on equivalent duration Treasuries. In other words, the credit spreads are WIDENING OUT; there is a higher risk involved in holding corporate bonds during such times so investors are demanding a higher return when compared to Treasuries. Corporate bond prices are falling at a faster rate compared to the price of Treasuries might be falling or rising at a slower rate than the rate at which Treasury prices are rising.
This can all be rather confusing, and it is not meant to be. Remember our basic premise – we are trying to discern investor sentiment.
These periods, during which LQD is losing ground to VGIT ( corporates losing grounds to treasuries) tend to be periods of slow growth, or at least, periods during which slow growth concerns are dominant.
Here is that same spread chart showing an intermediate term look at it.
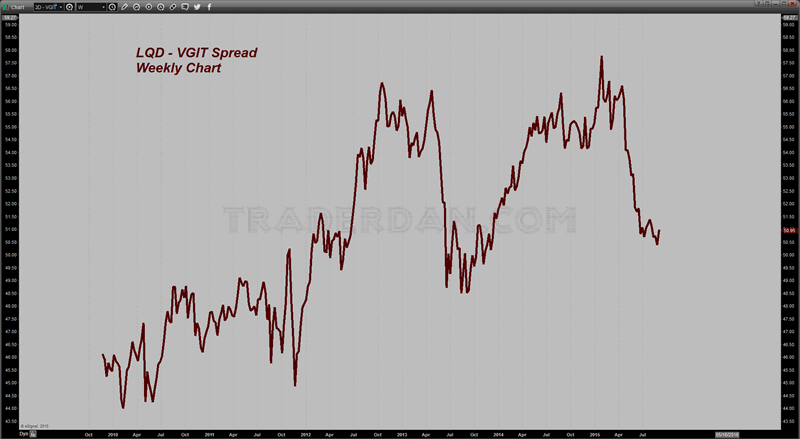
When viewed in this perspective, it is rather illuminating. For the better part of this year, LQD has been losing ground against VGIT and is back to levels last seen almost two years ago.
That is quite a bit of ground that has been lost in this spread is it not?
I am actually wondering whether or not this trend of a falling spread between these two ETF’s continues or it is going to reverse.
Much is going to depend on how market participants view Central Bank growth efforts as well as the government of China’s growth efforts.
I suspect that if this spread were to fall below those late-summer lows of 2013, things could get quite nasty as it might even signal that a global recession is unfolding.
The flip side to this is that while the more recent action of this spread has been disconcerting, there is bit of a longer term trend, moving from the left of the chart to the right of the chart, of a somewhat steady, if not sometimes erratic, move higher. That is telling us that while these periods or episodes during which investors do indeed become quite nervous, the markets have been able to work past them and slowly improve.
One last note before closing this set of comments – it is interesting to overlay the VIX upon this spread chart as the Volatility Index is a good barometer of investor complacency [comfort/confidence] or investor fear [concern/worry].
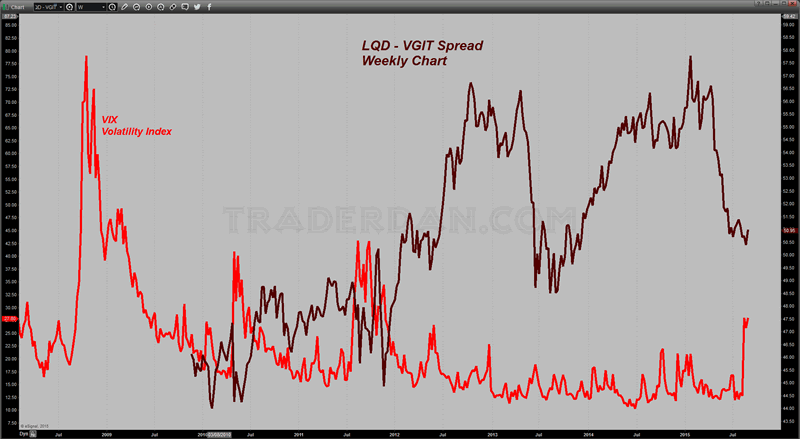
Unfortunately, some of these ETF’s are too new to have been around back during the height of the credit crisis when the VIX was soaring off the chart, for us to make any comparisons during that chaotic time period. However, one can detect a bit of a correlation between spikes in the VIX and moves lower in this spread. That would make sense seeing that a falling spread is a sign of discomfort or growth fears which generally tends to push the Volatility or Complacency Index as I prefer to call it, higher.
Your homework is to go back and read all this again until you truly understand reading investor sentiment from the credit spread between Investment Grade Corporate Bonds and Intermediate Term US Treasuries .
Dan Norcini
Dan Norcini is a professional off-the-floor commodities trader bringing more than 25 years experience in the markets to provide a trader's insight and commentary on the day's price action. His editorial contributions and supporting technical analysis charts cover a broad range of tradable entities including the precious metals and foreign exchange markets as well as the broader commodity world including the grain and livestock markets. He is a frequent contributor to both Reuters and Dow Jones as a market analyst for the livestock sector and can be on occasion be found as a source in the Wall Street Journal's commodities section. Trader Dan has also been a regular contributor in the past at Jim Sinclair's JS Mineset and King News World as well as may other Precious Metals oriented websites.
Copyright © 2015 Dan Norcini - All Rights Reserved
All ideas, opinions, and/or forecasts, expressed or implied herein, are for informational purposes only and should not be construed as a recommendation to invest, trade, and/or speculate in the markets. Any investments, trades, and/or speculations made in light of the ideas, opinions, and/or forecasts, expressed or implied herein, are committed at your own risk, financial or otherwise. The information on this site has been prepared without regard to any particular investor’s investment objectives, financial situation, and needs. Accordingly, investors should not act on any information on this site without obtaining specific advice from their financial advisor. Past performance is no guarantee of future results.
Dan Norcini Archive |
© 2005-2022 http://www.MarketOracle.co.uk - The Market Oracle is a FREE Daily Financial Markets Analysis & Forecasting online publication.