


Amid Stock Market Turmoil, Investors Cling to Hope. Why?
Stock-Markets / Stock Markets 2015 Sep 10, 2015 - 10:26 AM GMTBy: EWI

 History shows that many investors will hold stocks all the way down
I was watching financial television as the Dow Industrials fell 400-plus points on Sept. 1.
Two market professionals were interviewed: Both said the big decline in recent weeks represented a buying opportunity.
Optimism is so entrenched that even the worst month (August) for the Dow in five years didn't faze them.
Other market observers have also shrugged off the volatility. Here are just a few headlines:
- 10 oversold stocks ready to pop (CNBC, August 26)
- Why I'm throwing money at the stock market (Marketwatch, August 26)
- Why this bull market is not dead (CNBC, August 25)
- Buy the Dip Becomes Buy the Correction ... (Bloomberg, August 25)
- Is Stock Market's 'Black Monday' Time to Buy? Some Analysts Think So (NBC News, August 25)
- Relax, we're about to hit the bottom in stocks (CNBC, August 21)
This is an amazing display of optimism. Yet there is an explanation for this persistent hope in higher stock prices, namely:
Bullish psychology dissipates gradually.
Indeed, history suggests that many investors cling to hope all the way down.
In March 2008, the bear market was already underway. At that time, The Elliott Wave Financial Forecast had this chart and commentary:
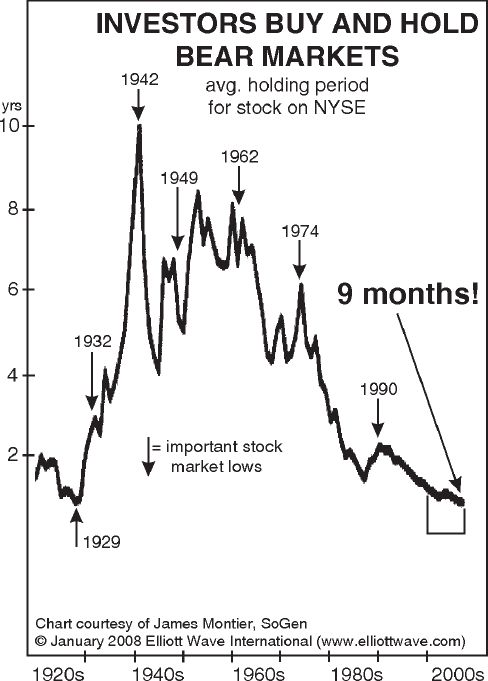
As this chart of the average holding period for a NYSE stock illustrates, investors actually turn up the hope and cling most tenaciously to their shares in bear markets. In bull markets they may espouse the buy and hold approach, but the chart shows that they don't actually practice what they preach. The average holding period plunged through the last 60+ years of advancing stock prices and fell to a low of just 9 months in 2007. The decline brought the average below the previous record lows of just under one year in 1929 ... . Upward spikes on the chart end near bear markets in the early 1940s, 1974 and 1990. Also notice that the most bruising period for stocks, the 13 years that followed the 1929 peak, produced the longest holding periods. So, the harder stocks fall, the tighter the grip of investors gets.
The Dow Industrials closed at 12,582 on February 28 (the date that the March 2008 Financial Forecast published). By May 2, an upward correction had taken the Dow to a close of 13,058.
Investors who had stayed in the market during the initial leg down believed they saw light at the end of the tunnel.
But, the worst of the decline was yet to come. The Dow closed at 6,547 on March 9, 2009.
Our analysis indicates that the next bear market could be far more severe.
Read our free report: Pandemonium in the Stock MarketUpdated with new charts and analysis No longer is extreme volatility contained to Greece or China. The massive waves are here in the States, just as our analysts predicted. Learn what's behind the recent market chaos. Read excerpts and see eye-opening charts from Robert Prechter's Elliott Wave Theorist, The Financial Forecast and our Short Term Update. |
This article was syndicated by Elliott Wave International and was originally published under the headline Amid Stock Market Turmoil, Investors Cling to Hope. Why?. EWI is the world's largest market forecasting firm. Its staff of full-time analysts led by Chartered Market Technician Robert Prechter provides 24-hour-a-day market analysis to institutional and private investors around the world.
About the Publisher, Elliott Wave International
Founded in 1979 by Robert R. Prechter Jr., Elliott Wave International (EWI) is the world's largest market forecasting firm. Its staff of full-time analysts provides 24-hour-a-day market analysis to institutional and private investors around the world.
© 2005-2022 http://www.MarketOracle.co.uk - The Market Oracle is a FREE Daily Financial Markets Analysis & Forecasting online publication.