Stock Market VIX Golden Cross Not Seen Since 2007
Stock-Markets / Volatility Sep 19, 2015 - 12:28 PM GMTBy: Ashraf_Laidi
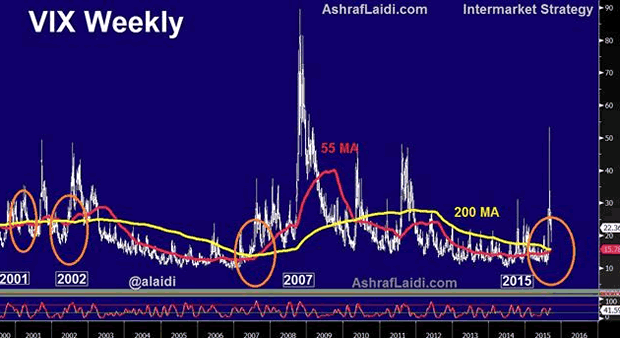
The VIX may be 60% below the six-year highs reached last month, but the confluence of medium-trend measures shows a technical development seen only in three occasions over the last 14 years; August 2001, August 2007 and July 2002. This development is the Golden Cross via the 55-week moving average crossing above the 200-week moving average. It is happening again today.

The relative infrequency of such occurrence highlights its importance. Unlike moving average cross-overs in hourly and daily charts, weekly crossovers carry particular significance as they reflect a more established build-up in the trend.
One potential weakness of medium-term crossovers is the possibility of being behind the trend. Many a times, a Death Cross coincided with a price bottom and vice versa for a Golden Cross. In comes the importance of momentum indicators in gauging the likelihood of a continuation/escalation in the price trend. A positive cross-over in a selected momentum oscillator is in fact developing, as was shared with Premium subscribers in today's video charts analysis.
Worthy of note is the time lag in weekly MA crossovers. Note that in 2007 and 2002, a considerable ascent in stochastics has taken place, which is not the case for long-term oscillators prevailing today. Whether this implies it is too early to expect a follow-up in volatility escalation remains to be seen.
A striking difference from 2007 and 2002 is the soaring volume of VIX and VIX-related products (VIX ETFs and leveraged ETFs), combined with high-frequency trading of these products by banks and algo firms. We've already argued on here that further volatility lies ahead.
Back to the Fed
Many were surprised by the Fed's rate decision to have failed in supressing volatility. Stocks dropped despite the Fed not raising rates. Late session selloffs in equities from dovish (or less hawkish than expected) Fed outcomes usually occur on the premise that traders reason the Fed knows something we don't. Intermeeting rate cuts are one example, such as the August 2007 discount rate cut.In this case, the Fed's assessment of "recent global economic and financial developments" i.e. China's transmission mechanism of global deflationary risks and emerging markets fallout from renewed USD is a new revelation to players, who were too occupied with falling US unemployment and stabilizing hourly earnings. There's more to this world, especially as advanced trading structures serve as a rapid conduit for market volatility.
By Ashraf Laidi
AshrafLaidi.com
Ashraf Laidi CEO of Intermarket Strategy and is the author of "Currency Trading and Intermarket Analysis: How to Profit from the Shifting Currents in Global Markets" Wiley Trading.
This publication is intended to be used for information purposes only and does not constitute investment advice.
Copyright © 2015 Ashraf Laidi
Ashraf Laidi Archive |
© 2005-2022 http://www.MarketOracle.co.uk - The Market Oracle is a FREE Daily Financial Markets Analysis & Forecasting online publication.


