


A Stocks Bear Market Is Now More Likely Than Not
Stock-Markets / Stocks Bear Market Sep 30, 2015 - 05:08 PM GMTBy: Richard_Shaw

 A Bear market from this Correction is more likely than not
- Yield Curve suggests Bull has further to go
- Breadth measures suggest Bull is exhausted
- Triple top and Head & Shoulders pattern suggests breakout to the downside
- 4 Factor Technical indicator suggests Bear is around the corner
[the following is a copy of our letter to clients last night (Sunday Sept 27)]
The stock market does stink right now.
How do I know? Well, stocks are in a Correction and gyrating up and down by large percentages, with a massive trading and investment press opinion tug of war on whether we are OK to return to S&P 500 price growth, or heading for a significant Bear market.
I also know because last Friday, Jim Cramer said, “This market stinks!” So there it is.
But let’s look at some data instead of headlines and 30 second interviews. The evidence is split, but mounting on the side of more pain to come.
First, here is our table of market indicators that we have been updating for you over the last several weeks. It has some positive items, but a lot more negative items, and the negatives are a bit more negative than before, while the positives are about the same magnitude.
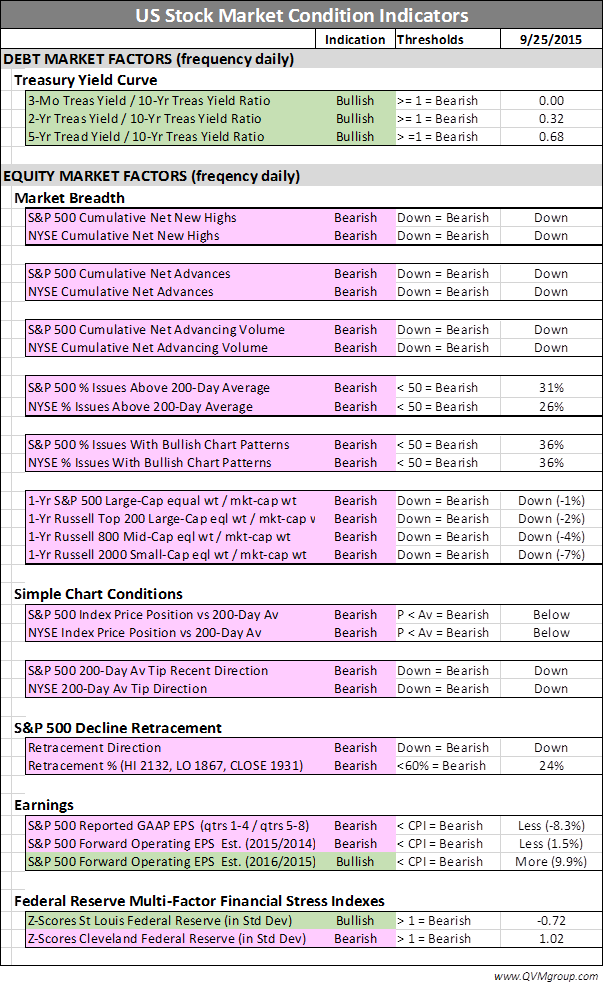
THE POSITIVE DATA:
The yield curve is still steep, more specifically the 10-year Treasury rate minus various shorter-term Treasury rates is still positive. In prior letters to you, we have shown that virtually all recessions are preceded by the yield going flat and then inverting (the spread between the longer and shorter rates going to zero, and then the shorter rates rising above the longer rates) – the New York Federal Reserve confirms that with their research.
Stock markets tend to go into Bears before recessions (and after, or coincidentally with, the yield curve going flat or inverted). The yield curve is still steep, and that is Bullish.
An argument could be made that in this artificially controlled interest rate market the yield spread is of little predictive value. Recognizing that, we are prepared to say the 3-mo/10-year spread may have no current meaning. However, the 2-year/10-year and the 5-yr/10-year is not Fed controlled (Fed influenced YES, but still in the domain of market forces, not just Fed decisions), so we think they have some predictive value.
The 2016 consensus earnings growth analyst forecast is nearly 10% higher than estimated 2015 operating earnings. That is good, but analysts tend to modify their estimate regularly and it’s hard to know what they will think 3 months from now, or how energy earnings as a major wild card will change their estimates.
The Saint Louis Fed Financial Stress Index is on the low side of a 1 standard deviation (“normal”) level. That is positive, but the different parameters measured by the Cleveland Fed for their stress index are at the high side of normal.
Those are the good things in our regular data set that suggest the Bull will continue.
THE NEGATIVE DATA:
Breadth is down:
- Cumulative net new highs are down
- Cumulative net advancing issues are down
- Cumulative net advancing volume is down
- Equal weight indexes are underperforming market-cap indexes.
Price chart conditions are negative:
- Prices are below moving trend line (200-day) moving averages
- Trend line leading edges are moving down
- Retracement from Aug low to July high is low.
Near-term earnings are down:
- Reported GAAP earnings for trailing 4 quarters is lower than the 4 quarters before that
- Operating earnings for 2015 over 2014 are down.
I am glad you asked, because there is more on the negative side.
Clearly, there are plenty of positive stock stories, and in the long-term it is not a good idea to bet against American industry or the stock market.
However, in the shorter-term, sometimes a year or two, earnings, valuations and stock prices can take a big hit, before resuming their historic rise.
Let’s look at some immediate stock market behavior that is concerning, and tilting very close to an outright Bear call – not totally yet, but it certainly starts to smell that way.
We look at four technical factors that, taken together, did a great job of calling the market tops in 2000 and 2007/2008, while at the same time they did not suggest jumping in and out of the market over common bumps in the road.
They were not as effective in the period 1980 through 1993, however, so maybe they have had their day. On the other hand, what has worked recently is likely to work in the present.
We have written about those factors and provided back testing data from 1980-August 2015 on our blog. When those 4 factors confirmed each other in 2000 and 2007, they did so at the market tops.
We look at monthly data to see:
- Whether the price is above or below the 12-month moving average (same length as the daily 200-day average)
- Whether the leading edge of the 12-month average is tilted up or down versus the prior month
- Whether the price is moving up at a reasonable pace (a time-based indicator called the parabolic stop & reverse)
- Whether the volume of trades is more at the upper end of daily price ranges or at the bottom end of daily price ranges (the money flow index).
The first two factors are necessary, but not sufficient, to trigger a major reversal alert – because alone they are prone to whipsaw.
The third and fourth factors measure different things than the first and second, and are necessary to confirm the alerts from the first and second to minimize whipsaw risk.
Here is a chart for the two most recent major market tops (our blog reviews all the trend reversals from 1980).
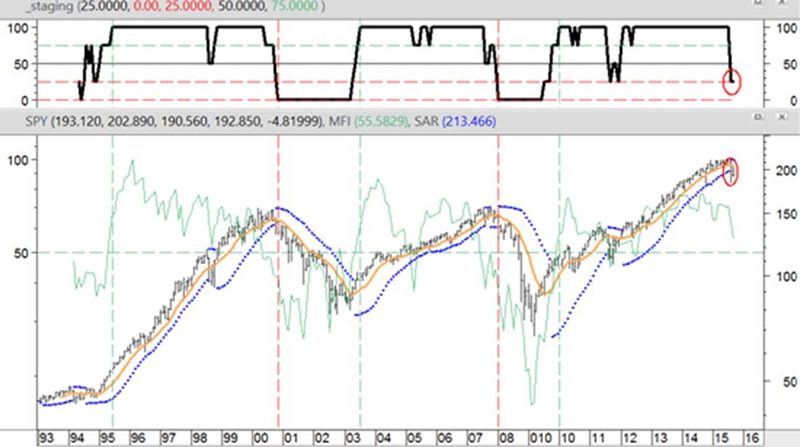
No method works all of the time, and this one has worked better since 1993 that before, but we think it still has utility.
You can see from this chart it did a great job at signaling reversals to the down side. It did a pretty good job on alerting reversals to the upside, but that is not our concern today. All eyes are on the lookout for a top, and one seems to be near.
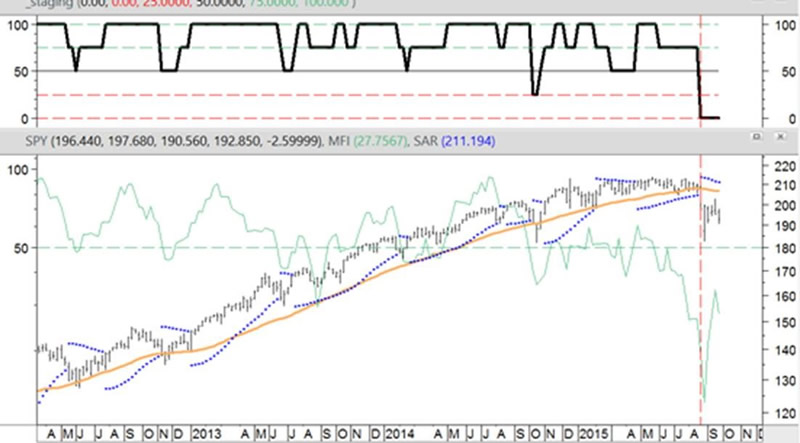
Because the method is monthly, the data in the chart above is through August, and in three days we will have September.
In the meantime, let’s try to peak around the corner by running the same data through a weekly filter. Weekly data is not as reliable as monthly data, and has lots of whipsaws, but that said, it forecasts a fully confirmed trend reversal come next Wednesday.
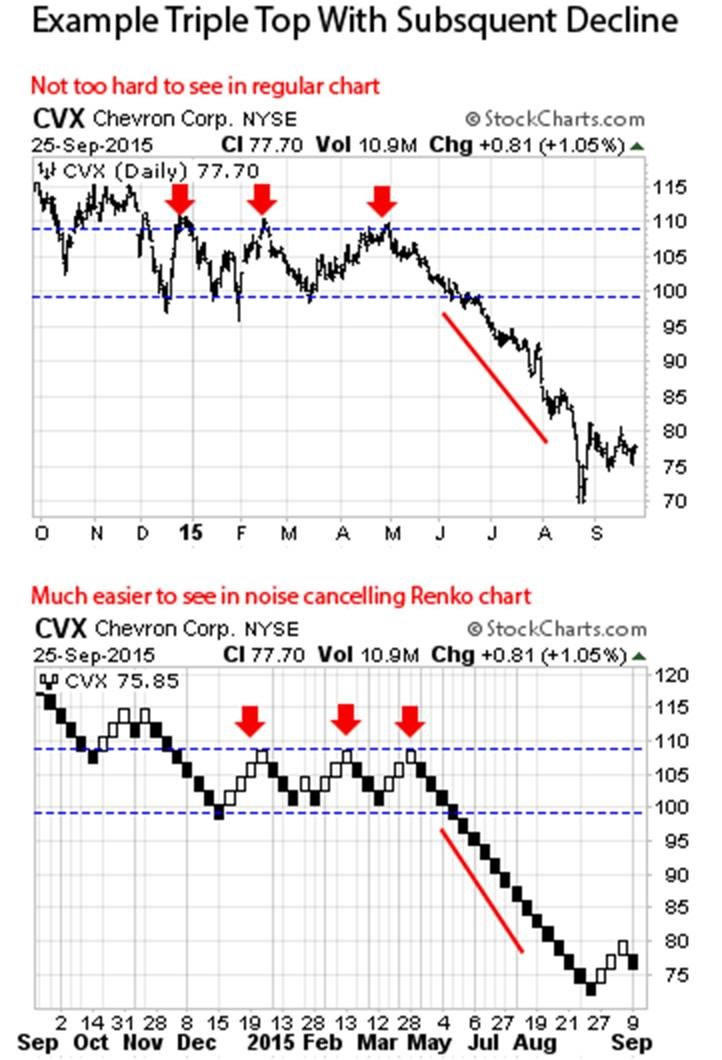
There is one more negative item, that deserves attention in this letter. It concerns a specific (actually two specific) chart patterns that are each typically indicative of a trend reversal.
One is called a Triple Top, and the other is called a Head & Shoulders Top (we have a detailed article about them on our blog), but here are the key points.
StockCharts.com describes Triple Tops this way:
“The Triple Top Reversal is a bearish reversal pattern … There are three equal highs followed by a break below support. As major reversal patterns, these patterns usually form over a 3 to 6 month period”
Here is a recent example of a Triple Top in Chevron – just to show you in isolation what one looks like:
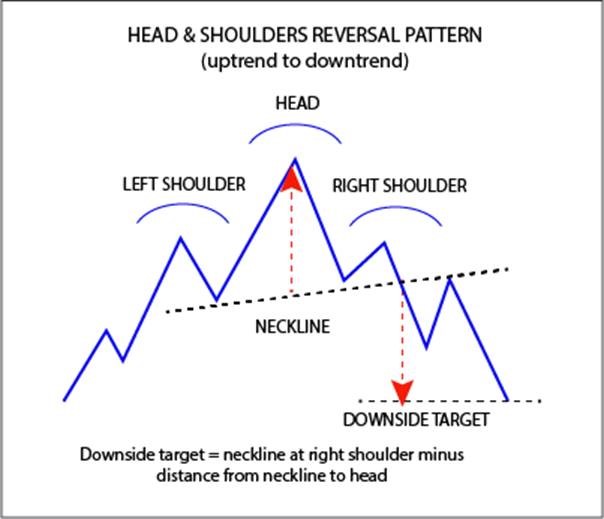
This is what StockCharts.com says about Head & Shoulders patterns:
“A Head and Shoulders reversal pattern forms after an uptrend, and its completion marks a trend reversal. The pattern contains three successive peaks with the middle peak (head) being the highest and the two outside peaks (shoulders) being low and roughly equal. The reaction lows of each peak can be connected to form support, or a neckline. … The head and shoulders pattern is one of the most common reversal formations. It is important to remember that it occurs after an uptrend and usually marks a major trend reversal when complete.”
And here is what a Head & Shoulders looks like, in hypothetical form:
Well, we think we see both patterns in this noise cancelled 3-year daily Renko chart of the S&P 500.
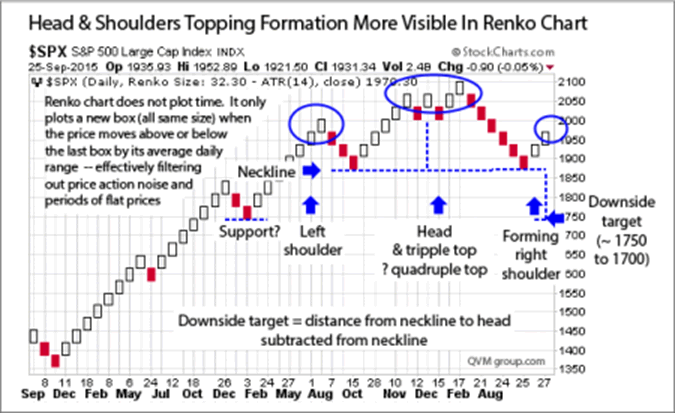
Once again, no chart analysis is perfect or consistently correct, but when you add all of the stuff above, including our major trend reversal indicator with this specific trend reversal chart pattern; it gets really hard to be warm to stocks at this time.
What you should know is that a major drawdown has a high probability of occurring, based on the evidence presented here.
What you should do depends on:
- when and if you will rely on your portfolio to support your lifestyle
- whether you have near-term capital expenditure commitments
- how long you think you are willing and able to emotionally wait for a major market drawdown to fully recover
- how you would feel if you experienced a major drawdown (even if you knew it would come back)
- whether your money is in a tax deferred or exempt account (where there would be no tax cost for making changes vs a regular account where embedded gains might be taxed more than the market may take)
- how you balance in your own mind the possibility of missing out on some capital appreciation if a Bear does not materialize versus the comfort that may come from getting out of the way
- and other things.
Most of you are either near retirement or currently living out of your portfolio, and most of you have limited ability to sleep well if another Bear comes along.
I don’t believe in market timing, which I view as quite different from gauging major trend direction.
If it’s raining or snowing with lots of wind, I am willing to be outside or on the road; but if there are public safety announcements of an approaching tornado or hurricane, I stay inside, off the road, and out of the weather. The same holds true, in my view, for investing.
Volatility comes and goes. Corrections come and go. It makes sense to stay fully invested for those, but for major trend reversals for those in or near retirement, without excess assets, and without an iron stomach; taking some money off the table makes sense to me. There will probably be attractive re-entry points later.
With a few exceptions, most of you have 40% to 100% of your equity allocation in cash at this time. That was accomplished over a period or weeks or months. I personally have about 75% of my equity allocation in cash.
I could be wrong, but personally value the peace of mind and capital protection more than the opportunity cost if this is a whipsaw and I must re-enter at a higher price.
How do you balance capital protection and peace of mind versus potential opportunity cost in this situation?
If you feel differently, let me know so I can adjust your allocations.
If you agree, look over your other assets you manage yourself, or that you have with other advisors, to see how they are positioned for a Bear.
I am tending to keep the assets I control for you heavily in cash for now.
Please feel free to call and discuss.
—END OF CIENT LETTER —-
Directly related funds are S&P 500 funds such as SPY, IVV, VOO and VFINX — but if we have a bear market, virtually all US equity funds and individual stocks are likely to be sucked in the whirlpool of declining prices. Correlations approach 1.00 in the early stage of rapid decline in a Bear market.
By Richard Shaw
http://www.qvmgroup.com
Richard Shaw leads the QVM team as President of QVM Group. Richard has extensive investment industry experience including serving on the board of directors of two large investment management companies, including Aberdeen Asset Management (listed London Stock Exchange) and as a charter investor and director of Lending Tree ( download short professional profile ). He provides portfolio design and management services to individual and corporate clients. He also edits the QVM investment blog. His writings are generally republished by SeekingAlpha and Reuters and are linked to sites such as Kiplinger and Yahoo Finance and other sites. He is a 1970 graduate of Dartmouth College.
Copyright 2006-2015 by QVM Group LLC All rights reserved.
Disclaimer: The above is a matter of opinion and is not intended as investment advice. Information and analysis above are derived from sources and utilizing methods believed reliable, but we cannot accept responsibility for any trading losses you may incur as a result of this analysis. Do your own due diligence.
Richard Shaw Archive |
© 2005-2022 http://www.MarketOracle.co.uk - The Market Oracle is a FREE Daily Financial Markets Analysis & Forecasting online publication.