


Stock Market Primary IV Still, or Primary V Underway?
Stock-Markets / Stock Markets 2015 Oct 03, 2015 - 09:06 PM GMTBy: Tony_Caldaro

 The week started at SPX 1931. After a gap down opening on Monday the market came within five points of retesting its August SPX 1867 low on Tuesday. Then the market gapped up Wednesday and Thursday hitting SPX 1927. On Friday the market gapped down to SPX 1894, then made a strong recovery and ended the week at 1951. For the week the SPX/DOW gained 1.00%, the NDX/NAZ gained 0.75%, and the DJ World index gained 0.70%. Economic reports for the week were mixed. On the uptick: the PCE, consumer confidence, personal income/spending, the ADP index, construction spending and the WLEI. On the downtick: pending home sales, the Chicago PMI, ISM manufacturing, factory orders, GDPn, monthly payrolls, plus weekly claims rose. Next week we get reports on the FOMC minutes and ISM services.
LONG TERM: bull market
Last weekend we discussed three potential market scenarios for the next several weeks/months. First: Primary IV ends in September. Second: Primary IV ended in August. Third: Primary IV will end in a few months. Details are in last weekend’s update.
This week the market completed five waves down from SPX 2021. However, the decline ended five points short of the August SPX 1867 low. When the market confirmed an uptrend shortly thereafter scenario #1 was eliminated. The uptrend confirmation suggested Primary IV had ended in August at SPX 1867. We are not completely convinced of this as the rally off the September SPX 1872 low has been kind of choppy. Therefore both scenarios remain in play until either the uptrend starts impulsing in earnest, or the choppiness continues.
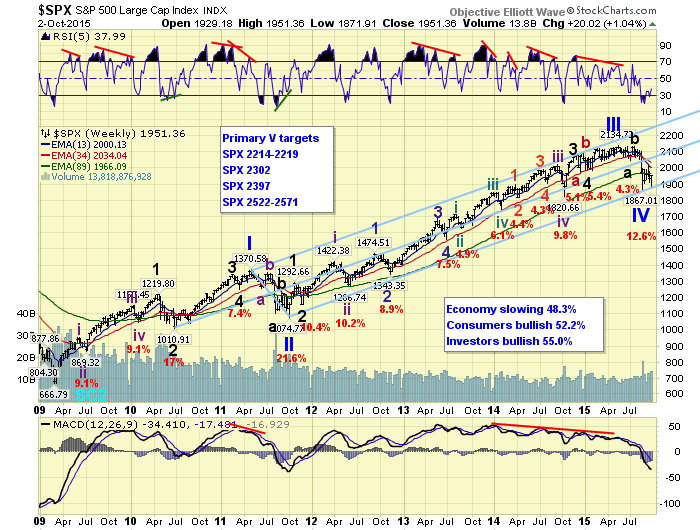
Longer term we are still tracking this bull market as a five Primary wave Cycle wave [1]. Primary waves I and II completed in 2011, and Primary III completed in mid-2015. Whether or not Primary IV has already completed, we are expecting Primary V and all time new highs before the bull market ends. The price targets posted on the weekly chart are relative to a SPX 1867 Primary IV low.
MEDIUM TERM: uptrend
The market confirmed an uptrend this week about 2% off the recent SPX 1872 low. This suggests that the August SPX 1867 low ended Primary IV, and Primary V has been underway since then. If you review the hourly chart, in the short term section, you will see a potential wave count for that scenario: Major 1 SPX 1993, Major 2 SPX 1872 (an irregular zigzag). This suggests that Major wave 3 is underway.
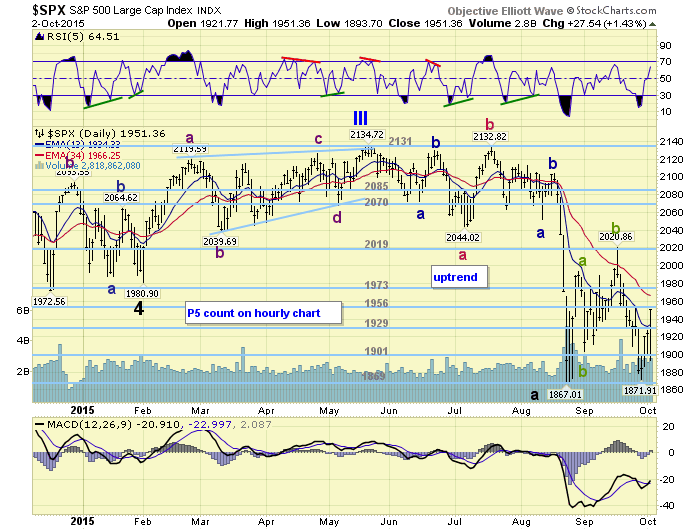
This is kind of wave activity is an odd beginning to an uptrend, as it looks quite choppy. With this in mind, we have reason to believe a more complex Primary IV is still possible. The daily chart above displays that possibility, as we have updated the count to display a Major wave A at SPX 1867, and Major wave B underway. Should this be correct we would expect the entire Primary IV correction to take about six months and form a double three: zigzag-flat. The downside targets would still be between the OEW 1828 and 1869 pivots. Medium term support is at the 1929 and 1901 pivots, with resistance at the 1956 and 1973 pivots.
SHORT TERM
If we count Primary IV ending in August at SPX 1867, we have the beginning of Primary V posted on the hourly chart below. Off the recent SPX 1872 low we now have a similar type of irregular pattern as Major waves 1 and 2. We have a rally to SPX 1917 for the first wave, then an irregular second wave: 1897-1927-1894. Another odd pattern, or just more choppy market activity. The rally off Friday’s SPX 1894 low was quite impressive as the market hit 1951 at the close. Best rally in a couple of weeks. However, we would have preferred seeing a clear five waves up before any sizeable correction. Not this choppy activity.
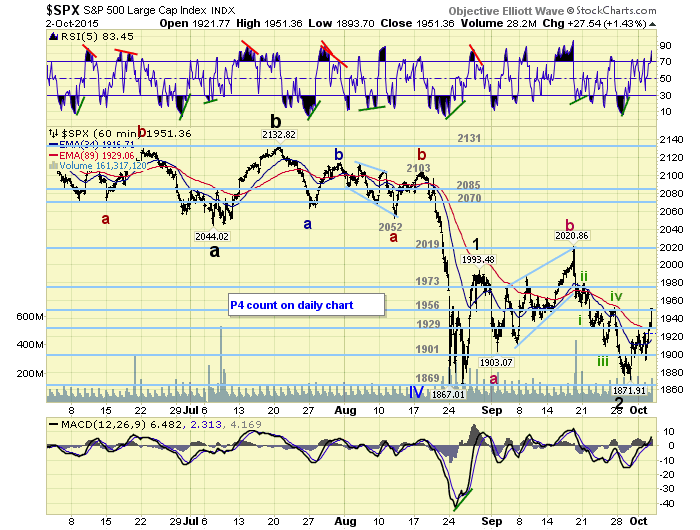
Under the extending Primary IV scenario we can see the current rally ending at either the 1956 or 1973 pivot ranges. Then another sizeable pullback. Should the market clear the 2019 pivot without any sizeable pullbacks, then Primary V is probably underway. Short term support is at the 1929 and 1901 pivots with resistance at the 1956 and 1973 pivots. Short term momentum ended the week quite overbought.
FOREIGN MARKETS
The Asian markets were quite mixed on the week and ended flat.
The European markets were also mixed but lost 0.8%.
The Commodity equity group were also mixed but gained 0.6%.
The DJ world index has not confirmed an uptrend yet but gained 0.7% on the week.
COMMODITIES
Last week’s odd situation all ended positive.
Bonds are in an uptrend and gained 1.2% on the week.
Crude is also in an uptrend and gained 0.4%.
Gold is in an uptrend too but lost 0.8%.
The USD is also in an uptrend but lost 0.3%.
NEXT WEEK
Monday: ISM services at 10am. Tuesday: the Trade deficit. Wednesday: Consumer credit. Thursday: weekly Jobless claims and the FOMC minutes. Friday: Export/Import prices and Wholesale inventories. Best to your weekend and week!
CHARTS: http://stockcharts.com/public/1269446/tenpp
After about 40 years of investing in the markets one learns that the markets are constantly changing, not only in price, but in what drives the markets. In the 1960s, the Nifty Fifty were the leaders of the stock market. In the 1970s, stock selection using Technical Analysis was important, as the market stayed with a trading range for the entire decade. In the 1980s, the market finally broke out of it doldrums, as the DOW broke through 1100 in 1982, and launched the greatest bull market on record.
Sharing is an important aspect of a life. Over 100 people have joined our group, from all walks of life, covering twenty three countries across the globe. It's been the most fun I have ever had in the market. Sharing uncommon knowledge, with investors. In hope of aiding them in finding their financial independence.
Copyright © 2015 Tony Caldaro - All Rights Reserved Disclaimer: The above is a matter of opinion provided for general information purposes only and is not intended as investment advice. Information and analysis above are derived from sources and utilising methods believed to be reliable, but we cannot accept responsibility for any losses you may incur as a result of this analysis. Individuals should consult with their personal financial advisors.
Tony Caldaro Archive |
© 2005-2022 http://www.MarketOracle.co.uk - The Market Oracle is a FREE Daily Financial Markets Analysis & Forecasting online publication.