


Gold Market, Two Charts
Commodities / Gold and Silver 2016 Jan 06, 2016 - 11:05 AM GMTBy: Denali_Guide

 As you build a model of the trend you want to find in a Sector or stock that has a trend you can find. Better yet if you can catch it while it changes trend from down to up.
Compare the left chart, GIMBO with the RIGHT hand chart, DIMBO. If we are constructing a model of a chart of a stock or sector we want to buy into, which one typifies the best situation that can be there for us : Bottoming, ready to move up, LEFT HAND SIDE, or CRESTING or ROLLING OVER with no decisive trend outlined.
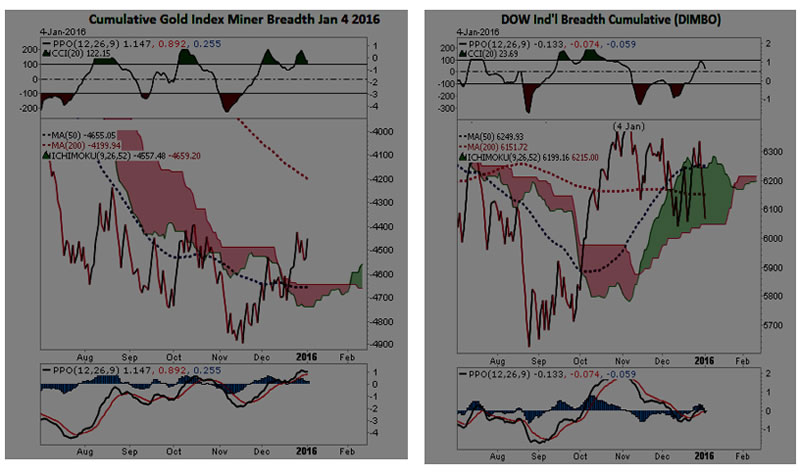
The LEFT hand chart represents Gold Miners and Precious Metals Derivatives.
The RIGHT Hand chart represents the Dow Indus trials. While there has been a lot of fireworks in the Industrial Sector, the Precious Metals Complex has been hated for quite some time, starting around 2012, and basically forgotten or vilified, in that Gold=Pet Rock, etc, and yet during these horrendous declines in the Industrials, the Golds hold their value or go up.
The OPERATIVE FACT to be grasped here, is that broad BREADTH Measurements, tend to PRECEDE movements in PRICE. Volume often has this function as well, but when Volume measurements are compromised, BREADTH Data often maintains its integrity.
WHAT DOES THIS MEAN ?
To me, who uses both Volume and Breadth Data to "Reckon" or determine a stock or sectors Position, i.e. is it high or low, in-trend etc, it means that the price will shift and to resolve any differences in direction, and begin to move, most often in the direction of the Breadth. Why BREADTH ? can be made to lie, to be untrue depending on whom is doing what. BREADTH on the other hand, is a bit harder to manipulate when it covers a whole sector from perhaps 100 to 400 stocks, and tracking their movements over time. My experience shows me it is far harder to push so many stocks in the right direction at the same time, than to say, affect price in the last 15 minutes of a trading day, for example.
ENABLING FRAUDLENT BEHAVIORS !!
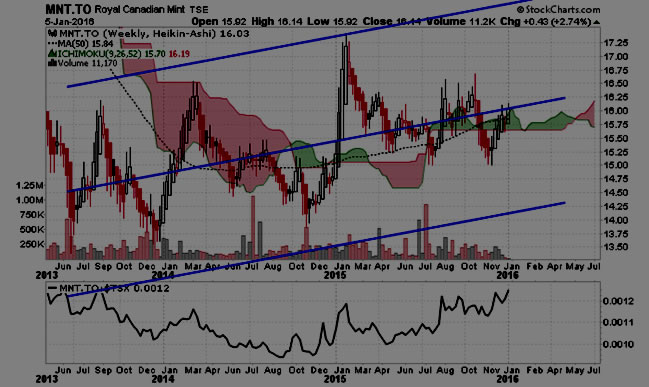
NOTICE CANADIAN GOLD RESERVE UPTREND !
WHY GOLD IS GOING DOWN: ITS NOT !
GOLD HAS BEEN TRENDING UP SINCE the Beginning of 2014
but would you really know it, if you watched KRIMEX KRAZY KUOTES
Look at what the Dominant Media is showing:
CAN YOU SPOT THE DIFFERENCE ?
Given there is a currency difference, even after adjustment of either,
it makes no difference in their RESPECTIVE DIRECTIONS.
WHY The Difference ?
The TOP Chart is a security OBLIGATED TO DELVER GOLD METAL(MNT.To)
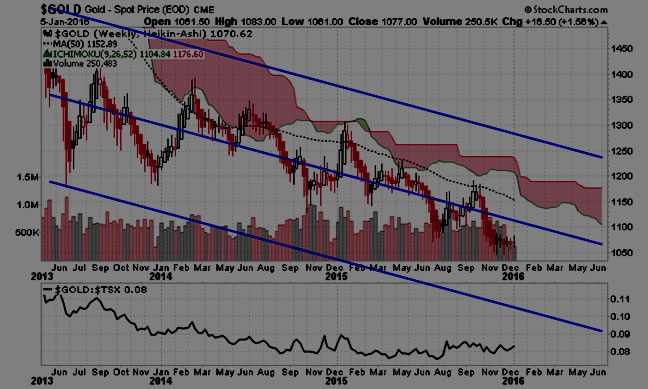
The Bottom chart delivers Paper instead of gold when it wishes.
Ask yourself which you prefer.
Chart MNT.To represents 1/100 of a Troy oz of gold, price in Canadian Dollars, delivered at the Royal Canadian Mint, in Ottawa, Ontario, Canada to your
account, usually accompanied by a Brinks truck.
The Chart of $GOLD represents the price of a troy oz of gold if it were delivered into your account at a brokerage firm as a credit to your account.
About 4% of the contracts in gold are settled in metal at the Exchanges option. Should metal not be available, the customer is obligated to accept an appropriate credit in the currency of exchange. See the difference !
By Denali Guide
http://denaliguidesummit.blogspot.ca
To the the charts involved, go here, to my Public Stock Charts Portfolio, and go to the last section. All charts update automatically. http://stockcharts.com/public/1398475/tenpp/1
© 2015 Copyright Denali Guide - All Rights Reserved
Disclaimer: The above is a matter of opinion provided for general information purposes only and is not intended as investment advice. Information and analysis above are derived from sources and utilising methods believed to be reliable, but we cannot accept responsibility for any losses you may incur as a result of this analysis. Individuals should consult with their personal financial advisors.
© 2005-2022 http://www.MarketOracle.co.uk - The Market Oracle is a FREE Daily Financial Markets Analysis & Forecasting online publication.