


BEA Estimates U.S. Economy 4th Quarter 2015 GDP Growth at 0.69%
Economics / US Economy Jan 29, 2016 - 04:52 PM GMTBy: CMI

 In their first "Preliminary" estimate of the US GDP for the fourth quarter of 2015, the Bureau of Economic Analysis (BEA) reported that the economy was growing at a +0.69% annualized rate, down -1.30% from the third quarter.
All of the key line items in this report showed meaningful deterioration relative to the third quarter. The reported growth in consumer spending was less than half of that recorded during the prior quarter. The growth in fixed investments nearly disappeared, as did growth in governmental spending. Exports continued to crater, showing outright contraction.
In fact, the only good news was that the ongoing inventory contraction weakened, while imports were less of a drag on the rest of the economy (the result of both lower oil prices and generally weakening demand). As we have mentioned a number of times before, the BEA's treatment of inventories can introduce noise and seriously distort the headline number over short terms -- which the BEA admits by also publishing a secondary headline that excludes the impact of inventories. But even this BEA "bottom line" (their "Real Final Sales of Domestic Product") was less than half of what was reported for the prior quarter.
One bright spot was that household income was reported to have grown during the quarter. Real annualized per capita disposable income was reported to be $38,445 per annum, up $197 from the previous quarter. The household savings rate rose to 5.4% -- up +0.2% from the prior quarter.
For this revision the BEA assumed an annualized deflator of 0.82%. During the same quarter (October 2015 through December 2015) the inflation recorded by the Bureau of Labor Statistics (BLS) in their CPI-U index was somewhat lower at 0.47%. Over estimating inflation results in pessimistic growth rates, and if the BEA's "nominal" data was deflated using CPI-U inflation information the headline growth number would be a somewhat better +1.04%.
Among the notable items in the report :
-- The headline contribution from consumer expenditures for goods was cut in half to +0.53% (down -0.55% from the previous quarter).
-- The contribution to the headline from consumer services weakened slightly to +0.93% (down -0.03% from the from the third quarter). The combined consumer contribution to the headline number was +1.46%, down -0.58% from 3Q-2015.
-- The headline contribution from commercial private fixed investments was a negligible +0.03%, down -0.57% from the prior quarter.
-- The contribution from inventories remained negative -- subtracting -0.45% from the headline number. This, however, is an improvement of +0.26% from the -0.71% recorded in 3Q-2015.
-- Governmental spending added only +0.12% to the headline, a contribution that was more than halved from the 0.32% recorded during the previous quarter. The reported growth was exclusively in Federal spending.
-- The contribution to the headline number from exports swung into contraction at -0.31%, significantly less than the essentially neutral reading (+0.09%) in the prior quarter. This contraction is likely to continue until either the dollar or global economic growth reverse direction.
-- Imports subtracted somewhat less from the headline number (-0.16%) than during the previous quarter. Again we can credit dollar growth, oil gluts and weakening domestic demand for this improvement.
-- The "real final sales of domestic product" is now reported to be growing at a +1.14% annualized rate, down substantially (more than halved) from the +2.70% in the prior quarter. This is the BEA's "bottom line" measurement of the economy and it excludes the reported inventory contraction.
-- Also as mentioned above, real per-capita annual disposable income was reported to have grown by $197 during the quarter, and the household savings rate also rose. However, it remains important to keep this improvement in perspective. Real per-capita annual disposable income is up only +4.82% in aggregate since the second quarter of 2008 -- a meager annualized +0.63% growth rate over the past 30 quarters.
The Numbers
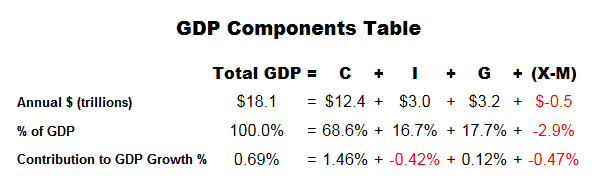
As a quick reminder, the classic definition of the GDP can be summarized with the following equation :
GDP = private consumption + gross private investment + government spending + (exports - imports)
or, as it is commonly expressed in algebraic shorthand :
GDP = C + I + G + (X-M)
In the new report the values for that equation (total dollars, percentage of the total GDP, and contribution to the final percentage growth number) are as follows :
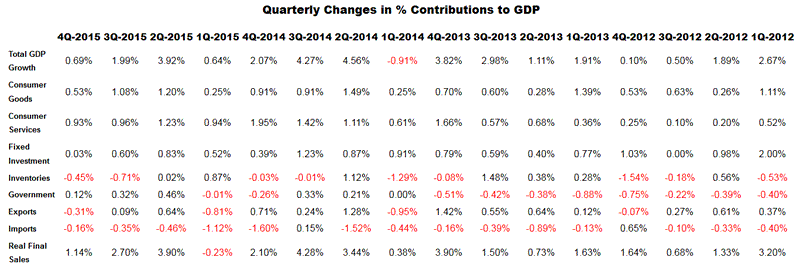
The quarter-to-quarter changes in the contributions that various components make to the overall GDP can be best understood from the table below, which breaks out the component contributions in more detail and over time. In the table below we have split the "C" component into goods and services, split the "I" component into fixed investment and inventories, separated exports from imports, added a line for the BEA's "Real Final Sales of Domestic Product" and listed the quarters in columns with the most current to the left :
Summary and Commentary
This report should be a wake-up call for anyone thinking that the "recovery" is steaming forward in utter isolation from the global slowdown :
-- The recorded growth dropped by nearly two-thirds, critically led by much weaker growth in consumer demand for goods and commercial fixed investments.
-- Exports fell into significant contraction.
-- The sustained growth in consumer spending for services is not discretionary -- it is primarily a consequence of rising Obamacare health care costs.
-- The quarter-to-quarter increase in the household savings rate (to 5.4%) goes a long ways towards explaining the ongoing weak retail sales. Household monies that are no longer being spent at the gasoline pump are simply being saved. This implies that households are not particularly confident when looking forward -- given international headlines and domestic political "fear, uncertainty and doubt" (FUD).
-- Finally, the numbers above show materially weaker economic growth within the US, after several prior lackluster quarters. There is a downward trend in the numbers which, absent an economic miracle, points to economic contraction in the near future.
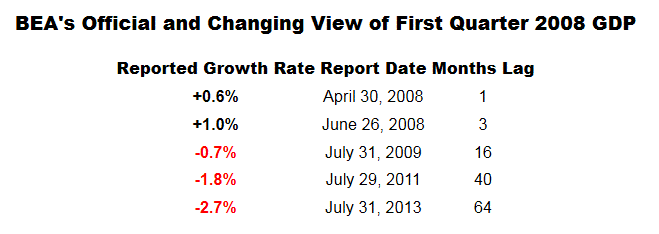
We should again note that the BEA is famously incapable of accurately monitoring a dynamically weakening economy in "real time." They may eventually get it right, but only several years after the fact. For example, consider the BEA's constantly changing numbers for the first quarter of 2008 -- from a very similar +0.6% growth shown in the April 30th, 2008 "real time" preliminary report (which, incidentally, reportedly grew to +1.0% over the next two months -- and astonishingly remained at that level through the first of the annual July revisions in 2008) to an admittedly disastrous -2.7% contraction after further consideration and massive subsequent revisions (some 64 months later) :
We are not suggesting that the fourth quarter of 2015 was as bad as the first quarter of 2008. We are merely pointing out that the economy was likely in a dynamic transition towards lower (and potentially negative) growth -- and that we may not know exactly what the actual 4Q-2015 growth rate was for some time to come.
Consumer Metrics InstituteTM
Home of Daily Consumer Leading Indicators
http://www.consumerindexes.com
© 2015 Copyright Consumer Metrics Institute - All Rights Reserved Disclaimer: The above is a matter of opinion provided for general information purposes only and is not intended as investment advice. Information and analysis above are derived from sources and utilising methods believed to be reliable, but we cannot accept responsibility for any losses you may incur as a result of this analysis. Individuals should consult with their personal financial advisors.
© 2005-2022 http://www.MarketOracle.co.uk - The Market Oracle is a FREE Daily Financial Markets Analysis & Forecasting online publication.