


Stocks Bear Market Continues
Stock-Markets / Stock Markets 2016 Feb 07, 2016 - 01:10 PM GMTBy: Tony_Caldaro

 The market started the week at SPX 1940. On Monday the market rose to SPX 1947 and then traded down to 1872 by early Wednesday. Then the market rallied to SPX 1927 early Thursday, only to selloff again and end the week at SPX 1880. For the week the SPX/DOW lost 2.35%, the NDX/NAZ lost 5.70%, and the DJ World index lost 2.20%. Economic reports for the week were again biased negatively. On the uptick: personal income, construction spending, consumer credit, Q1 GDP, plus the unemployment rate improved. On the downtick: ISM manufacturing/services, the ADP, factory orders, monthly payrolls, the WLEI, plus weekly jobless claims and the trade deficit worsened. Next week will be highlighted by FED chair Yellen’s semiannual monetary policy report to Congress.
LONG TERM: bear market
During the entire six year bull market, the longest period between new highs was May 2011 to Feb 2012. During that period Primary I had topped in May, Primary II bottomed in October, and the market was solidly in an uptrend from a December low that would last until April 2012. Currently the market made its highest price in May 2015, sold off until August, made a lower high in October, and then an even lower low in January. The price action since May looks more like a bear market than anything that occurred during the bull market. We continue to see a Cycle wave [2] bear market underway.
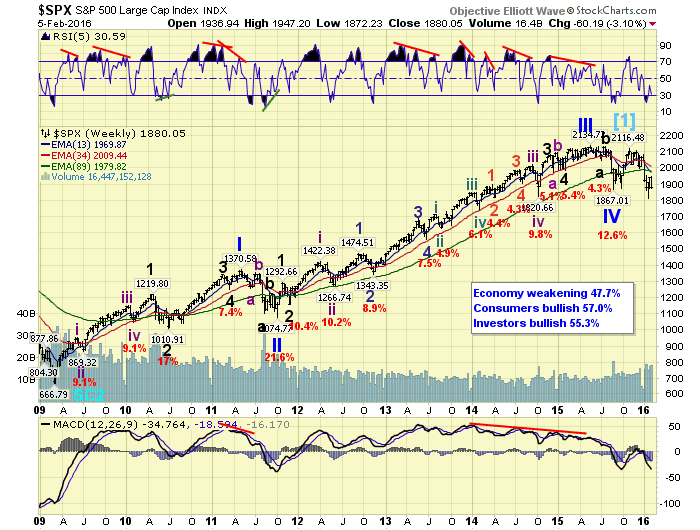
The six year bull market completed its expected five Primary wave advance with a somewhat abrupt ending. Primary waves I and II completed in 2011, and Primary waves III, IV and V completed in 2015. Primary V, however, impulse higher in a strong uptrend but failed to make new all time highs by about 1%. This completed Cycle wave [1] and a Cycle wave [2] bear market is now underway. Cycle waves typically lose 45% to 50% of market value before they bottom. This would suggest a low around SPX 1100, more or less, by sometime in 2017. The decline may be a simple zigzag, or a complex three. With only one confirmed downtrend underway it is still too early to determine the pattern.
MEDIUM TERM:
After the Primary IV low at SPX 1867 in August, the market rallied in five impulse waves SPX: 1993-1872-2116-2019-2104. The fifth wave failed to make a higher high falling short of the third wave at SPX 2116. Also this Primary V uptrend fell short of the bull market high at SPX 2135. So in effect the bull market ended with a failed fifth of a failed fifth wave. This was quite an abrupt ending to what had been a very good bull market, i.e. the SPX more than tripled in the six years.
After Primary V ended the market entered a three wave downtrend, made lower lows, and hit SPX 1812 in mid-January. Then with a positive daily RSI divergence, and a quite oversold MACD we expected the first uptrend of the bear market. After about 2.5 weeks of market activity, and a 135 point rally to SPX 1947, the advance is not looking like what we had expected. While the SPX/DOW are still well above their mid-January lows, the NDX/NAZ are both getting quite close to making lower lows. This should not be happening during an uptrend.
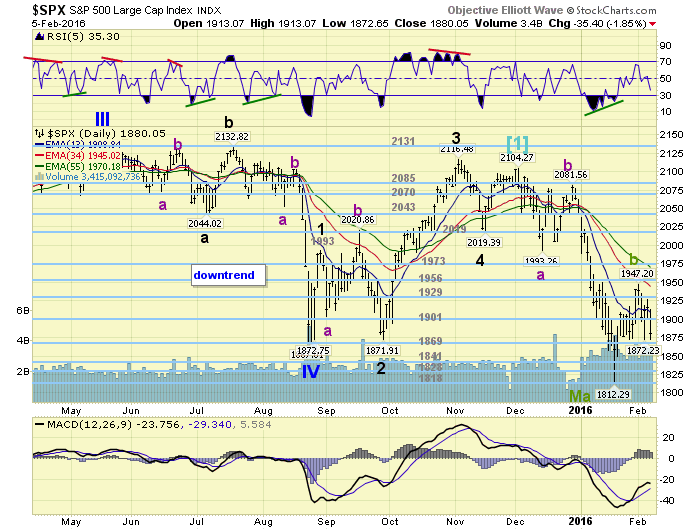
At the mid-January lows we expected an uptrend to unfold, with a worse case trading range during the month of February. This can still occur. But if the market breaks down much further we have to accept that the downtrend from the Primary V high is still underway. We had counted the three waves into the SPX 1812 low as corrective. Suggesting the market is not impulsing down, but unfolding in a more complex set of a-b-c’s. Should the downtrend extend we will be forced to find a new short term wave filter, since the bull market’s filter will no longer be in effect. Medium term support is at the 1869 and 1841 pivots, with resistance at the 1901 and 1929 pivots.
SHORT TERM
Tracking the SPX/DOW, in isolation of the NDX/NAZ, the waves have been unfolding somewhat as expected. After a potential Major wave A downtrend low at SPX 1812, the market has rallied in an expected Major wave B uptrend to SPX 1947. Since we have not confirmed that the downtrend has ended, we labeled that low with a tentative green Major A. The rally to SPX 1947 has not confirmed an uptrend either, so we are stuck, at this point, with two tentative green labels. Should the downtrend resume we will have the answer to this dilemma. Should the market stay in a trading range the trend confirmations will come eventually.
Remaining with the current labeling, we have counted three Intermediate waves up to SPX 1947 Major B wave high: 1909-1874-1947. After that we counted three wave down for Minor a of Intermediate A SPX: 1897-1914-1872. Minor b was also three waves SPX: 1918-1901-1927. This count suggests Minor wave c of Intermediate A is currently underway. Should Minor c = Minor a, then the market should find support around SPX 1852. Anything lower than that would suggest the initial downtrend is resuming.
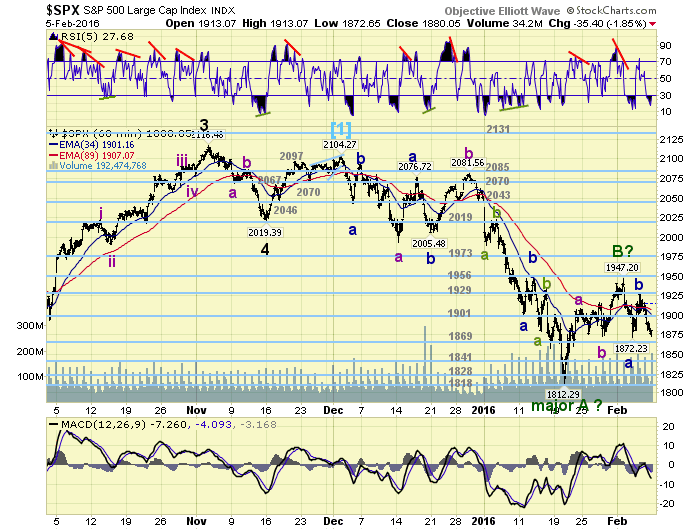
One other possibility, since the market has now found support on four separate occasions in the SPX 1870’s, (twice last week and twice this week), Major wave B may be much more complex. For now we would expect the market to drop to around SPX 1852 before it starts to rally in an Intermediate wave B. Short term support is at the 1869 and 1841 pivots, with resistance at the 1901 and 1929 pivots. Short term momentum ended the week quite oversold. Best to your trading this volatile market!
FOREIGN MARKETS
Asian markets were quite mixed for a net loss of 0.3%.
European markets were all lower and lost 5.5%.
The Commodity equity group was mixed and lost 0.7%.
The DJ World index remains in a downtrend and lost 2.2%.
COMMODITIES
Bonds continue to uptrend and gained 0.6%.
Crude is still in a downtrend and lost 8.1%.
Gold is still in an uptrend and gained 5.0%.
The USD is in a downtrend and lost 2.6% on the week.
NEXT WEEK
Tuesday: Wholesale inventories. Wednesday: testimony from FED chair Yellen before Congress, and the Budget deficit. Thursday: testimony continues before the Senate, and weekly Jobless claims. Friday: Export/Import prices, Retail sales, Business inventories and Consumer sentiment. Best to your weekend and week!
CHARTS: http://stockcharts.com/public/1269446/tenpp
After about 40 years of investing in the markets one learns that the markets are constantly changing, not only in price, but in what drives the markets. In the 1960s, the Nifty Fifty were the leaders of the stock market. In the 1970s, stock selection using Technical Analysis was important, as the market stayed with a trading range for the entire decade. In the 1980s, the market finally broke out of it doldrums, as the DOW broke through 1100 in 1982, and launched the greatest bull market on record.
Sharing is an important aspect of a life. Over 100 people have joined our group, from all walks of life, covering twenty three countries across the globe. It's been the most fun I have ever had in the market. Sharing uncommon knowledge, with investors. In hope of aiding them in finding their financial independence.
Copyright © 2016 Tony Caldaro - All Rights Reserved Disclaimer: The above is a matter of opinion provided for general information purposes only and is not intended as investment advice. Information and analysis above are derived from sources and utilising methods believed to be reliable, but we cannot accept responsibility for any losses you may incur as a result of this analysis. Individuals should consult with their personal financial advisors.
Tony Caldaro Archive |
© 2005-2022 http://www.MarketOracle.co.uk - The Market Oracle is a FREE Daily Financial Markets Analysis & Forecasting online publication.