


Stock Market At Important Support
Stock-Markets / Stock Markets 2016 Feb 08, 2016 - 12:33 PM GMTBy: Andre_Gratian

 Current Position of the Market
SPX: Long-term trend - Severe correction underway.
SPX: Intermediate trend - Is the counter-trend rally over?
Analysis of the short-term trend is done on a daily basis with the help of hourly charts. It is an important adjunct to the analysis of daily and weekly charts which discuss longer market trends.
AT IMPORTANT SUPPORT
Market Overview
After reaching its projection target of 1946, which was probably (but unconfirmed) the top of the a-b-c corrective rally from 1812, SPX retraced to 1872, rallied to 1927, and toward the end of the week came back down to re-test the 1872 level once more. It appeared to hold once again, since we closed at 1880, but we'll find out for sure on Monday morning when the market opens. Since the rally from the 1812 low, that level has been tested at least four times and held each time. That makes it an important support level; all the more because the index appears to be making a head & shoulders formation with a horizontal line at 1872 as the neck line. If it breaks, at a minimum we could challenge 1812 once again and eventually go lower if we are truly in a bear market.
This break could come as early as next week if we have some negative news over the week-end. Although, with SPX ending Friday with a 35-point loss, we are very oversold near-term and could get a price bounce first. If so, we will have to wait until the next time that 1872 is challenged to see if it is still capable of holding.
A sign that the weakness may be intensifying was demonstrated by the NDX performance on Friday. It came very close to its January 20 low, which is the equivalent of 1812 in the SPX. In past bear markets, NDX has been a leader on the downside. Until recently, it had performed at least as well if not better than SPX, making its final high in November 2015 while SPX topped in May. If its former relative strength is now turning into relative weakness, it is not a positive prospect for the bulls.
SPX Chart Analysis
Daily chart (This chart, and others below, are courtesy of QCharts.com.)
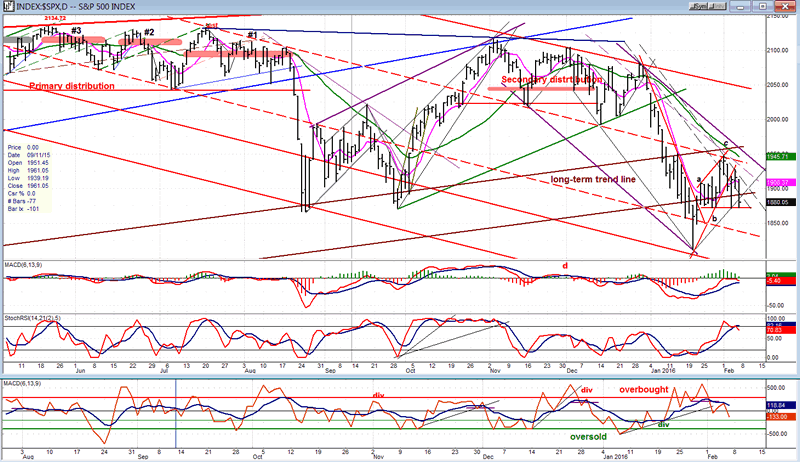
In the last letter, l suggested that the upward corrective pattern from 1812 was most likely developing as an a-b-c correction, and this appears to have been correct. That correction ended up forming a wedge pattern which was broken on the downside and re-tested. Prices then dropped again with Friday's 35-point decline which found support one more time at the 1872 level. When a wedge is broken, prices have a tendency to retrace all the way down to the point of origin which, in this case, would be 1812 on SPX. Friday ended the day oversold on a near-term basis, so it would not be unusual for the index to have a bounce, first. In fact, that would help to complete the H&S pattern which is potentially developing above the 1872 neckline. It would also make sense for the wedge pattern to be a consolidation in a downtrend, and that we are engaged in another period of re-distribution above the 1872 level that will re-confirm the higher counts. This is often what takes place in downtrend consolidations.
Last week, I also mentioned that a parallel to the primary downtrend line (red line connecting the secondary tops) which was marked by a heavy dashed line which was drawn from the July 20 peak, had already served as support and resistance for several short-term moves, and that it would probably provide resistance for the "c" wave of the corrective pattern. This is in fact what happened! It was a pretty safe supposition considering that the connection point (1946) was also a projection for the rally high. When we drop lower, we could also find at least temporary support on the lower dashed parallel which also already connects several short-term lows and highs along its course.
Until recently, the momentum indicators (upper two) were in an uptrend until the SRSI became overbought and the MACD reached the zero line. They have now begun to roll over, but with only the SRSI making a bearish cross on Friday. The A/D oscillator, however, turned well ahead of them and showed some pronounced negative divergence when the index made its top. This kind of pattern in the indicators suggests that prices may not tarry around their present level, even if an oversold rebound first occurs.
Hourly chart
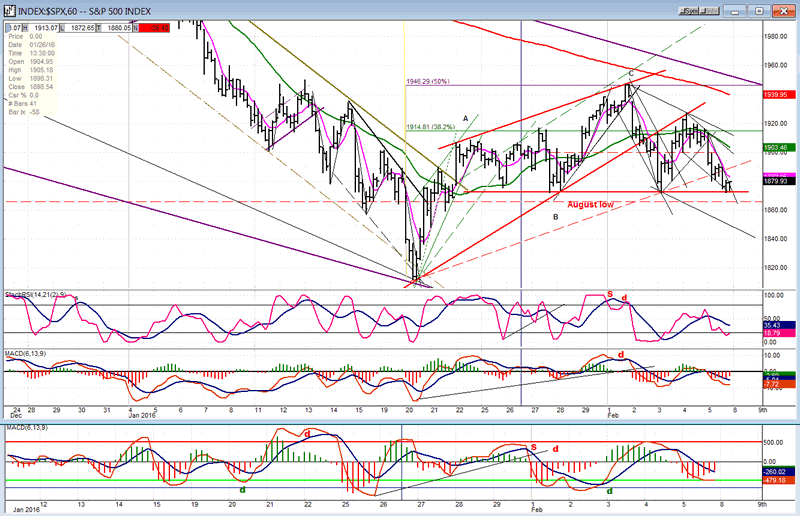
The rally from 1812 initially retraced .382 of the decline from 2082 to form the "a" wave of the correction, pulled back to the 1872 support for the "b" wave, and continued on to a 50% retracement for the "c" wave. It then dropped back down to the 1872 level, which coincided exactly with the parallel of the top rally line taken across the 1812 bottom, retraced to back-test the lower trend line of the wedge pattern, and pulled back one more time to the 1872 support. How can these moves possibly be described as "random"?
Because Friday's return to 1872 filled a minimum count taken across the 1915 level, we could get a rebound on Monday, especially because of some deceleration in the price and the indicators. Also, the A/D numbers were far less negative than they should have been for a 35-point decline. How much of a bounce is in question! On the 60m chart we can see much more clearly the potential H&S pattern which is taking shape above the 1872 level. Since there are two tops on the left shoulder (if that's what it turns out to be) a bounce back to the 1920 level would ideally form the second right shoulder before breaking the neckline. It all sounds too logical to be true, but considering the logic of the moves described above, not impossible. I should note that the indicators are still in a downtrend, and that a liberal count across 1915 has a target between the Jan. 20 low and the 1872 level. We'll have to see what the market wants to do next week, but be aware that the majority of H&S formations ultimately fail to reach completion and develop into other price patterns. In this case, however, breaking the neckline immediately would confirm the formation as an H&S formation. We do not have to wait for a second right shoulder to be formed.
XBD (American Securities Broker/Dealer)
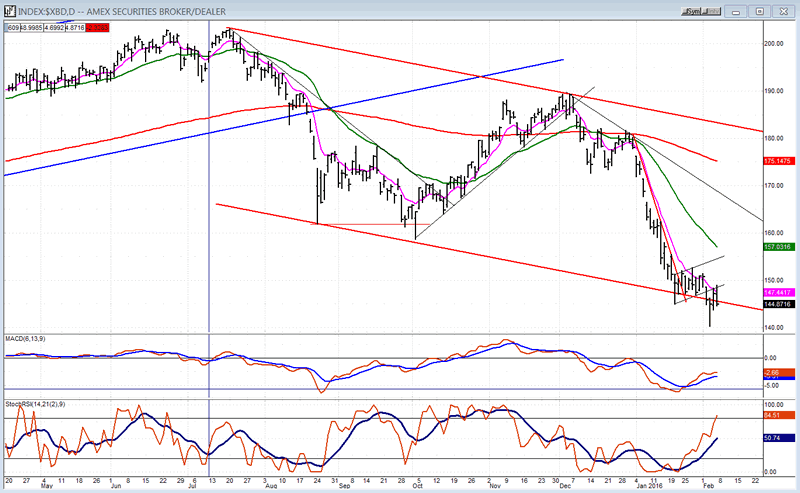
XBD is showing some near-term relative strength to SPX, but that may not very meaningful on such a short time frame. XBD has been far weaker than SPX over the past few weeks and had probably gone temporarily as far as it could by reaching the bottom of its channel, so a little consolidation would not be unusual under the circumstances. But since TRAN, which also led the market on the downside, is also showing some near-term relative strength to SPX, we should pay attention to the changes of mood of these two indexes. This could be a warning which cannot be overlooked.
On the other hand, the sudden spurt of relative weakness in Nasdaq 100 has the exact opposite connotation! We'll just have to wait for a few days and see what this all means instead of guessing at it.
UUP (dollar ETF)
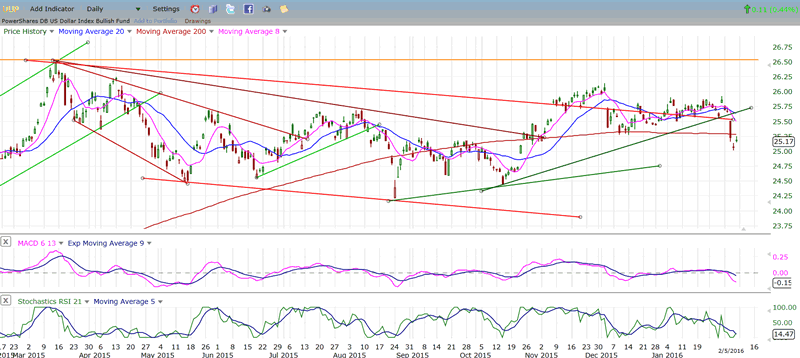
UUP finally gave up trying to make a new high right away and fell back into the intermediate correction pattern that started at the March 2015 high. This pattern is now almost one year-old, and could extend quite a bit longer until the index has better economic and other reasons to be bought aggressively.
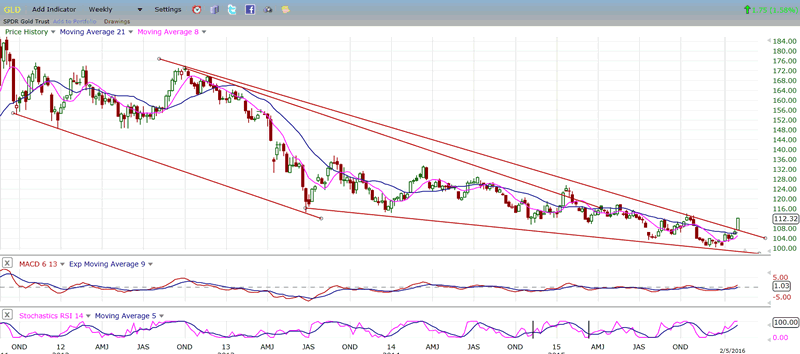
GLD (Gold trust)
On this weekly chart, we can see that after a sharp sell-off from its 2011 high, GLD continued to decline -- but at a more moderate pace -- forming a bullish wedge pattern which appears to have ended last week when it broke out of it. This breakout is more decisive than any of the others, which failed to follow through and resulted in a new low shortly thereafter, causing the top wedge line to be readjusted several times.
In spite of this apparent breakout, GLD is still in a declining pattern of lower highs and lower lows. In order to show that it has started a significant uptrend, this pattern will have to reverse. First, it will have to surpass its last short-term high and on its next pull-back, it will have to end its correction at least above 105. With its longer cycles recently bottoming, this should be feasible and, after the next correction, GLD should confirm its reversal and start a real uptrend.
The index has recently gone from 101 to 111, and has reached the initial target of 109/111 which had been set for it. It will have to reach 114 to get above its previous short-term high. This is very possible, after a minor correction, since its base carries a potential liberal count to that price level; but be aware that after reaching it, it could start another correction to re-test is recent 101 low.
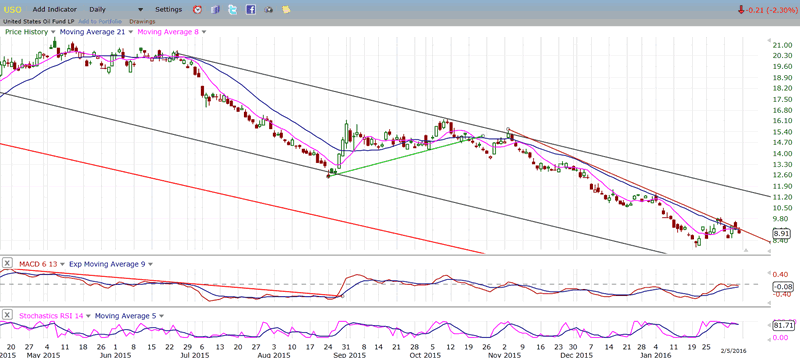
USO (United States Oil Fund)
USO has reached my long-term projection of 8 and has bounced. It is now challenging its steepest downtrend line, breaching it in the last few days but not being able to close above it. Even if it does, it may be quite a while before it can challenge the upper channel line from June 2015. Any security which has had that protracted a decline cannot expect to re-establish a bullish trend before a period of healing during which a substantial base is formed.
From a fundamental point of view, it is unlikely that the current glut in crude will be alleviated anytime soon, especially if we have entered a period of weakening global economies. Consequently, USO is likely to remain near its low, gyrating in a narrow range for some time to come.
Summary
It looks as if SPX concluded its a-b-c correction in an uptrend when it reached 1947 early last week. Since then, it has retraced about 75 points down to the important 1868-1872 support zone which was formed by the August/September 2015 lows. Significant re-distribution has occurred above that level which calls for a move lower, confirming the counts taken across primary and secondary levels of distribution.
Because of the short-term market condition, it is not unconceivable that a price bounce will first take place and, if it cannot gather any upside momentum, there is a very good chance that the next test of that support zone will result in its breach.
Andre
FREE TRIAL SUBSCRIPTION
If precision in market timing for all time framesis something that you find important, you should
Consider taking a trial subscription to my service. It is free, and you will have four weeks to evaluate its worth. It embodies many years of research with the eventual goal of understanding as perfectly as possible how the market functions. I believe that I have achieved this goal.
For a FREE 4-week trial, Send an email to: info@marketurningpoints.com
For further subscription options, payment plans, and for important general information, I encourage
you to visit my website at www.marketurningpoints.com. It contains summaries of my background, my
investment and trading strategies, and my unique method of intra-day communication with
subscribers. I have also started an archive of former newsletters so that you can not only evaluate past performance, but also be aware of the increasing accuracy of forecasts.
Disclaimer - The above comments about the financial markets are based purely on what I consider to be sound technical analysis principles uncompromised by fundamental considerations. They represent my own opinion and are not meant to be construed as trading or investment advice, but are offered as an analytical point of view which might be of interest to those who follow stock market cycles and technical analysis.
Andre Gratian Archive |
© 2005-2022 http://www.MarketOracle.co.uk - The Market Oracle is a FREE Daily Financial Markets Analysis & Forecasting online publication.