


Stocks Bear Market Rally Continues
Stock-Markets / Stocks Bear Market Feb 20, 2016 - 05:23 PM GMTBy: Tony_Caldaro

 An eventful holiday shortened week. The market started the week on Tuesday at SPX 1865. After gap up openings on Tuesday/Wednesday the SPX reached 1931. After that it pulled back to 1902 on Friday. For the week the SPX/DOW gained 2.7%, NDX/NAZ gained 3.7%, and the DJ World index gained 3.8%. Economics reports for the week were again biased negative. On the uptick: the PPI, industrial production, capacity utilization, GDPn, plus weekly jobless claims were lower. On the downtick: NY/Philly FED, NAHB, housing starts, building permits, leading indicators and the WLEI. Next week we get the second estimate to Q4 GDP, the PCE, and more housing reports.
LONG TERM: bear market
We continue to see the market activity over the past several months as bearish long term. We have counted a five primary wave advance from March 2009 to December 2015 to end Cycle wave [1]. Primary waves I and II ended in 2011, and Primary waves III, IV and V ended in 2015 with a fifth wave failure. Initially we had a difficult time recalling a fifth wave failure that ended a bull market. After reviewing historical charts we observed it had occurred just once before: during the 1949-1953 bull market.
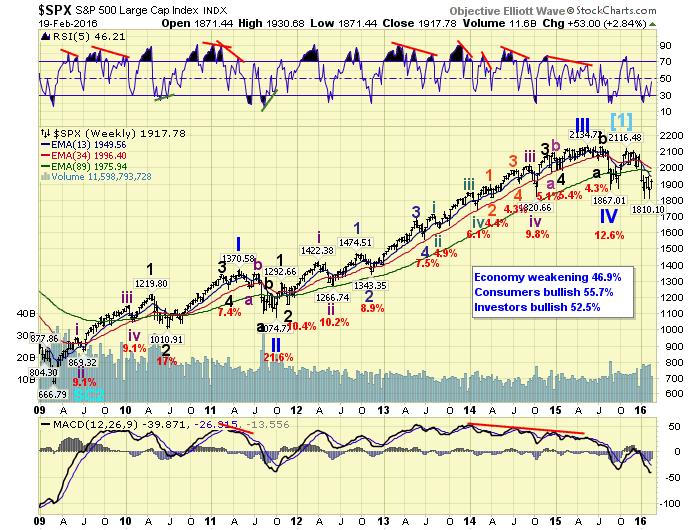
Now that we know we are not dealing with something new we can look ahead. During the entire 20th century there were only two Cycle wave bear markets: 1937-1942 and 1973-1974. Those two bear markets created the largest market losses of the entire 1932-2007 Super cycle period: 52% and 47% respectively. This is the main reason we are expecting this bear market to produce a 45% to 50% market loss. The wave structure of the bull market, and a 61.8% retracement of the bull market also support this scenario.
When five wave advances have weak fifth waves, support usually appears between the high of wave 1 and the low of wave 2. In this case between SPX 1371 and 1075. A 61.8% retracement of the entire bull market also falls into that range at SPX 1228. As does a 45% to 50% market loss: SPX 1174 to 1068. Our bear market target is approximately SPX 1100 by sometime in 2017.
MEDIUM TERM: uptrend likely underway
After the unorthodox high at SPX 2104 to end the bull market, we counted a choppy five waves down into the recent low at SPX 1810. We had noted last weekend there were several technical indications that the Major wave A downtrend had ended. We then projected three areas where a Major wave B uptrend could top out: the 1956 and 1973 pivots, plus SPX 1999.
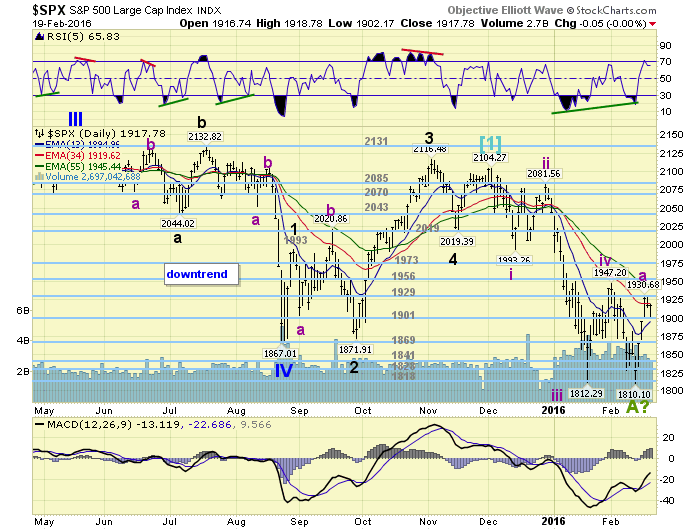
After that low the market rallied to SPX 1865 to end the week. Then continued higher to 1931 by Wednesday this week. We counted this entire advance as five waves, and likely Intermediate A of Major wave B: 1836-1822-1888-1875-1931. After reaching that high on Wednesday the market pulled back into Friday hitting SPX 1902. While we believe this pullback, Intermediate wave B, could decline further into the 1880’s. It has already done enough to label SPX 1931 as the high of Int. A. When the current pullback concludes, the market should again rally to one of the three levels noted above to complete the uptrend. This could/should occur by early March. After that, Major wave C should take the market to new lows for the bear market. Medium term support is at the 1901 and 1869 pivots, with resistance at the 1929 and 1956 pivots.
SHORT TERM
As noted above we had counted five waves up from SPX 1810 to 1931. At the high we observed the first short term negative divergence of the entire rally, and immediately the market started to pullback. At Friday’s SPX 1902 low the market did get slightly oversold. But we would expect Intermediate wave B to get more oversold than that before it concludes. A pullback into the SPX 1880’s would fit. Then a rally to the 1956 or 1973 pivots should end this unconfirmed uptrend.
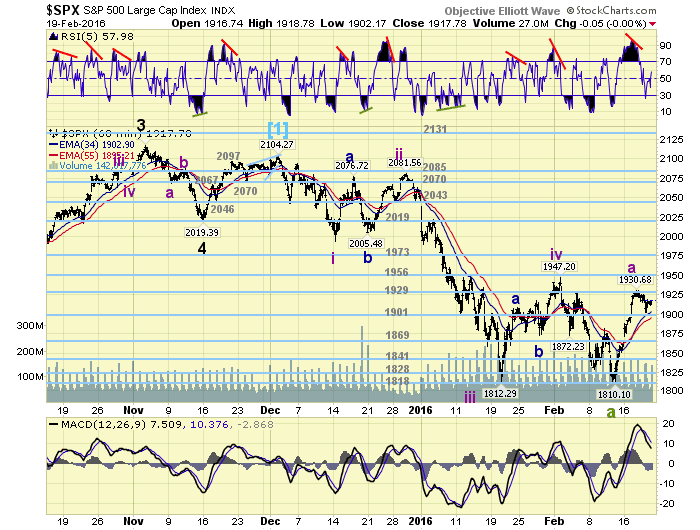
Short term support is at the 1901 and 1869 pivots, with resistance at the 1929 and 1956 pivots. Short term momentum ended the week at neutral. Best to your trading next week!
FOREIGN MARKETS
The Asian markets were mostly higher gaining 4.2% on the week.
European markets were all higher also gaining 4.2%.
The Commodity equity group were all higher too, gaining 5.5% on the week.
The DJ World index gained 3.8% on the week.
COMMODITIES
Bonds continue to uptrend but lost 0.1% on the week.
Crude is trying to uptrend and gained 9.4% on the week.
Gold is in an uptrend but lost 0.6% in a volatile week.
The USD is still in a downtrend but gained 0.7%.
NEXT WEEK
Tuesday: Case-Shiller, Consumer confidence, Existing homes sales and a speech by FED vice chair Fischer. Wednesday: New homes sales. Thursday: weekly Jobless claims, Durable goods, and FHFA housing. Friday: Q4 GDP (est. +0.5%), Personal income/spending, PCE prices, Consumer sentiment and speeches from FED governors Powell and Brainard. Best to your weekend and week!
CHARTS: http://stockcharts.com/public/1269446/tenpp
After about 40 years of investing in the markets one learns that the markets are constantly changing, not only in price, but in what drives the markets. In the 1960s, the Nifty Fifty were the leaders of the stock market. In the 1970s, stock selection using Technical Analysis was important, as the market stayed with a trading range for the entire decade. In the 1980s, the market finally broke out of it doldrums, as the DOW broke through 1100 in 1982, and launched the greatest bull market on record.
Sharing is an important aspect of a life. Over 100 people have joined our group, from all walks of life, covering twenty three countries across the globe. It's been the most fun I have ever had in the market. Sharing uncommon knowledge, with investors. In hope of aiding them in finding their financial independence.
Copyright © 2016 Tony Caldaro - All Rights Reserved Disclaimer: The above is a matter of opinion provided for general information purposes only and is not intended as investment advice. Information and analysis above are derived from sources and utilising methods believed to be reliable, but we cannot accept responsibility for any losses you may incur as a result of this analysis. Individuals should consult with their personal financial advisors.
Tony Caldaro Archive |
© 2005-2022 http://www.MarketOracle.co.uk - The Market Oracle is a FREE Daily Financial Markets Analysis & Forecasting online publication.