


Stocks Bear Market Rally Continues
Stock-Markets / Stock Markets 2016 Mar 19, 2016 - 06:19 PM GMTBy: Tony_Caldaro

 The week started at SPX 2022. After a small rally to SPX 2025 on Monday the market pulled back to 2005 on Tuesday. After that the market continued to rise for the rest of the week, with only 10 point pullbacks, to SPX 2052 on Friday. Ending the week at SPX 2050. For the week the SPX/DOW gained 1.80%, the NDX/NAZ gained 1.05%, and the DJ World gained 1.40%. On the economic front reports continued to come in with a negative bias. On the uptick: the NY/Philly FED, business inventories, leading indicators housing starts, and the WLEI. On the downtick: retail sales, the CPI/PPI, building permits, industrial production, capacity utilization, consumer sentiment, GDPN, plus weekly jobless claims rose. Next week we get reports on Durable goods, the Q4 GDP and more Housing.
LONG TERM: bear market
Ever since the all time high in May 2015 at SPX 2135 this market has been on quite a roller coaster ride. During the past 10 months it has declined to SPX 1867, risen to 2116, declined to 1810, and now risen to 2052. Net progress since even the beginning of 2015: -0.4%. Great for day/swing traders, but not much for investors.
From 2009-2015 the market was in a long term uptrend bull market. During that period of time we had remained long term bullish, and then turned long term bearish in the second week of January 2016. The market made a downtrend low the following month at SPX 1810, and has risen since then to 2052 this week. Quite a rebound for what we consider a B wave uptrend in an ongoing bear market. In fact the rebound appears to have been led by the cyclical indices, and not the growth indices which typically leads in bull markets. The SPX/DOW have retraced about 75% of their entire decline, while the NDX/NAZ have retraced about 60%. During the bull market the SPX/DOW gained about 200%, while the NDX/NAZ gained about 340%.
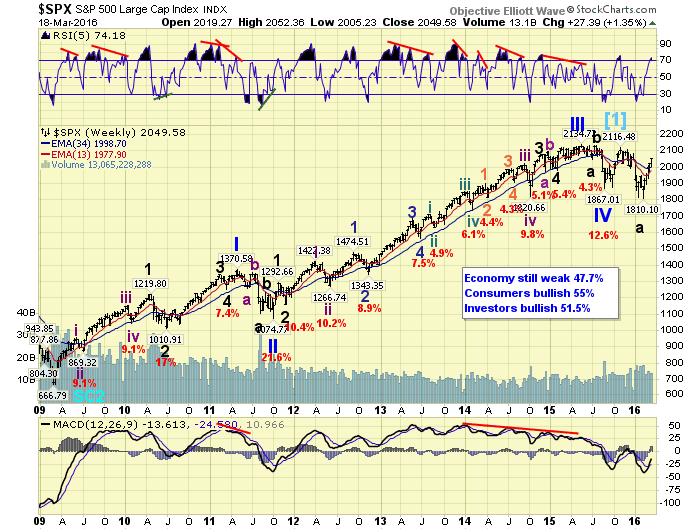
The long term count remains the same, with five Primary waves from 2009-2015 ending a Cycle wave [1] bull market. A Cycle wave [2] bear market should be underway now. There has been some debate about where the bull market ended: May at SPX 2135 or December at SPX 2116/2104. Initially we were set on a December top, but have been reviewing some counts that suggest a May top might be a better fit. Regardless of the outcome the key level to watch going forward is SPX 2135. A rally above that level would force a re-evaluation of the bear market scenario. For the past couple of years this has certainly been a difficult market.
MEDIUM TERM: uptrend
When this uptrend began about five weeks ago, we initially set an upside target between the 1956 and 1973 pivots by the first week of March. Now in the third week of March, and at SPX 2050, we obviously underestimated the strength of this advance. This has caused some to doubt the bear market scenario, and some hardship for others. While we always aim to do our best, there are times when we just get it wrong.
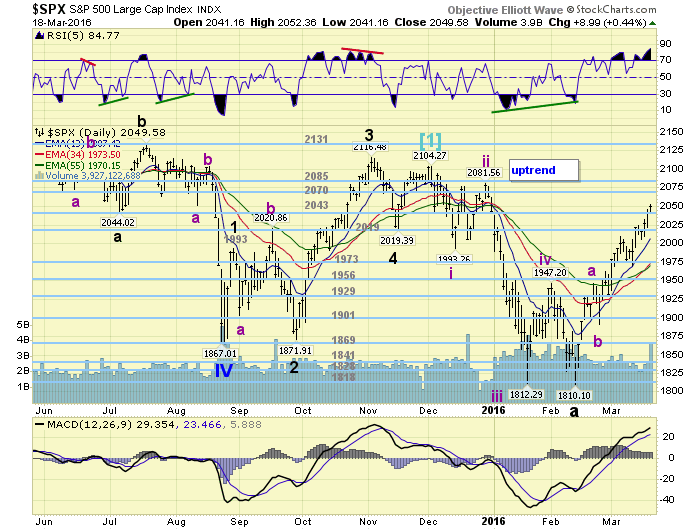
We continue to maintain the same count we posted last weekend: Int. A SPX 1947, Int. B SPX 1891, and Int. C so far 2052. This uptrend still looks like a 5-3-5 zigzag, with the fifth wave of Int. C still underway SPX: 1963-1932-2009-1969-2052. With Minor 3 (77 pts.), exceeding Minor 1 (72 pts.), Minor 5 can be any length and it has already exceeded both (83 pts.). The key level to watch going forward, to potentially break this pattern, is Thursday’s low at SPX 2022. A drop down to that level would technically confirm the five wave pattern has ended. Medium term support is at the 2043 and 2019 pivots, with resistance at the 2070 and 2085 pivots.
SHORT TERM
Int. C of this Intermediate ABC Major B wave uptrend, has created a nice rising channel noted on the hourly chart. Here the lower trend line break also appears to be around SPX 2022. This entire uptrend, in fact, looks similar to the October uptrend too. Then the market advanced 244 points in five weeks. This uptrend has advanced 242 points in five weeks as well. Something to keep in mind.
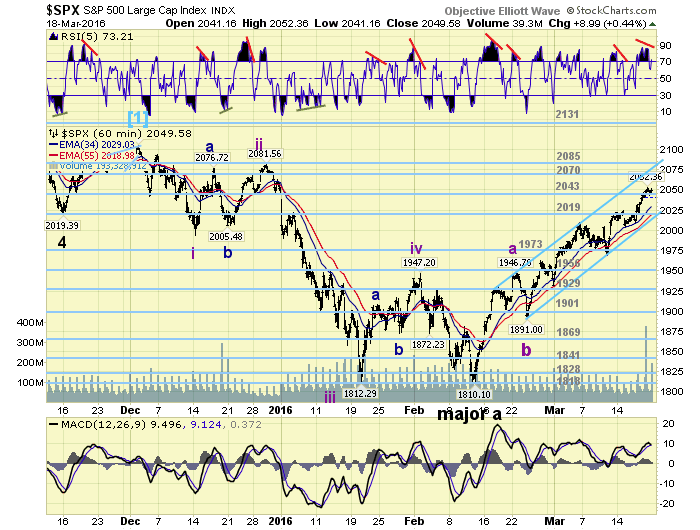
Short term support is at the 2043 and 2019 pivots, with resistance at the 2070 and 2085 pivots. Short term momentum ended the week with a slight negative divergence. Best to your weekend, and trading next week!
FOREIGN MARKETS
Asian markets were mostly higher for a net gain of 1.8%.
European markets were mostly lower for a net loss of 1.0%.
The Commodity equity group gained 2.3%.
The DJ World index is still in an uptrend and gained 1.4%.
COMMODITIES
Bonds continue to downtrend but gained 0.8%.
Crude continues to uptrend and gained 6.9%.
Gold continues to uptrend as well and gained 0.4%.
The USD remains in a downtrend and lost 1.2%.
NEXT WEEK
Monday: Existing home sales at 10am. Tuesday: the FHFA housing index. Wednesday: New home sales. Thursday: weekly Jobless claims and Durable goods orders. Friday: Q4 GDP (est. +1.0%).
CHARTS: http://stockcharts.com/public/1269446/tenpp
After about 40 years of investing in the markets one learns that the markets are constantly changing, not only in price, but in what drives the markets. In the 1960s, the Nifty Fifty were the leaders of the stock market. In the 1970s, stock selection using Technical Analysis was important, as the market stayed with a trading range for the entire decade. In the 1980s, the market finally broke out of it doldrums, as the DOW broke through 1100 in 1982, and launched the greatest bull market on record.
Sharing is an important aspect of a life. Over 100 people have joined our group, from all walks of life, covering twenty three countries across the globe. It's been the most fun I have ever had in the market. Sharing uncommon knowledge, with investors. In hope of aiding them in finding their financial independence.
Copyright © 2016 Tony Caldaro - All Rights Reserved Disclaimer: The above is a matter of opinion provided for general information purposes only and is not intended as investment advice. Information and analysis above are derived from sources and utilising methods believed to be reliable, but we cannot accept responsibility for any losses you may incur as a result of this analysis. Individuals should consult with their personal financial advisors.
Tony Caldaro Archive |
© 2005-2022 http://www.MarketOracle.co.uk - The Market Oracle is a FREE Daily Financial Markets Analysis & Forecasting online publication.