


US Stock Market Bulls Are the Most Complacent Since 2008!
Stock-Markets / Stock Markets 2016 Apr 08, 2016 - 10:49 AM GMTBy: Chris_Vermeulen

 I have to trade and invest in the markets that I have before me and not the ones that I desire! Therefore, I must be able to approach the market place from a completely ‘unbiased’ perspective. I do not care if the markets doubles in price, or if it is cut in half. I take advantage of moves in both directions by using my ‘short term spikes’ which I have shown you, over the past couple of weeks, in order to lock in profits in as short a period as 48 hours.
I implement my longer term cycle analysis to take advantage of moves in both directions which last several weeks or months.
Today, there are two ‘psychological’ situations that lead to big events within the markets. They represent ‘mirror images’ of one another.
The first issue is ‘overconfidence’. Whether this is ‘overconfidence’ in a market, a strategy of oneself, ‘overconfidence’ leads to carrying the largest position at the most inopportune time.
The second issue is ‘indecision’. There are times, when a market approaches critical levels and yet the trading population appears ‘uninterested’ or even ‘frightened’ to respond. In either case, ‘indecision’ leads to fewer participants, while ‘overconfidence’ leads to too many.
Currently, my focus is the examination of a ‘very bullish’ net commercial trader position in the face of the lowest commercial participation rate since the economic collapse of 2008/2009.
I may frequently reference the ‘net commercial trader’ position and ‘commercial trader momentum’, in my analysis. The total position is really only meaningful at its’ ‘extremes’. The most important factor to keep in mind, while reviewing the following charts, is the mathematical relationship between the ‘total and net positions’.
The ‘net commercial trader position’ is measured by subtracting the reported short positions from the reported long positions, of the given traders. Long contracts minus short contracts equal the ‘net position’.
This measure of sentiment is generated by the ‘consensuses of the commercial trader population.
This ‘net position’ predicts the degree of bullish or bearish sentiment. The total position measures the overall level of interest in a market, at any given point in time. This is one of those times when total interest must be used in conjunction with the net position in order to avoid trading while under a false set of assumptions. Therefore, while the current sentiment is positive, most of the ‘collective smart money’ is sitting on the sidelines, ‘uninterested’.
Fear is the primary reason for ‘smart money’ to be sitting on the ‘sidelines’ as the Dow Jones and SPX futures near their all- time highs. Commercial traders would most typically be the sellers of this rally.
Their ‘indecision’ is again noted by their exceptionally low participation rate, as the current global economic environment continues to waiver back and forth, from one economic announcement to the next, as I refer to as ‘news driven events’.
U.S. growth versus global stagnation appears to be the order of the day as the FED attempts to commence withdrawing a decades’ worth of stimulus. ‘Commercial traders’ are typically the most well-informed group of market participants and usually leads the markets’ next move. Their uncertainty is, significant, at this point in time.
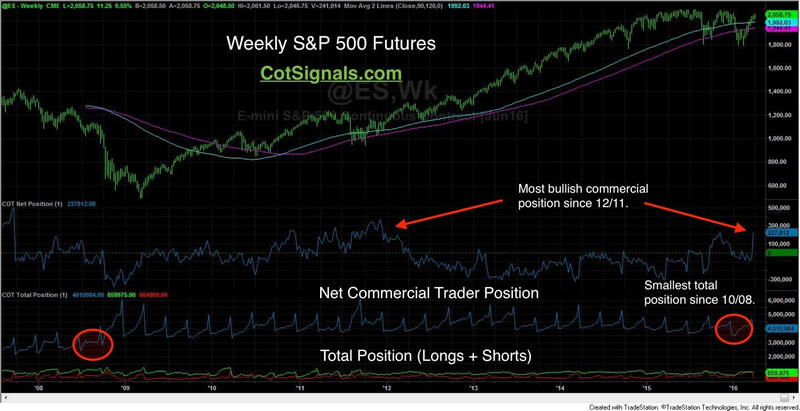
The SPX futures represent an interesting situation! The ‘commercial trader’ participation rate is at the lowest point that it been since 2008, yet the ‘net commercial position’ is close to a multi-year high. This means that the ‘commercial traders’ currently in the market are exceptionally bullish, despite it being only a few of them.
The question to ask today is… ‘Are they still right?’ My opinion is that they may be right, for a while. My expectation is that we will see the broad stock market continue to rally into ‘nominal new highs’ over the next week still.
However, I also believe that this ‘nominal new high’ could coincide with the ‘peak’. This will present itself with weaker underpinnings and momentum divergence, or new ‘net commercial selling pressure’, informing us of the first confirmation of a ‘top’.
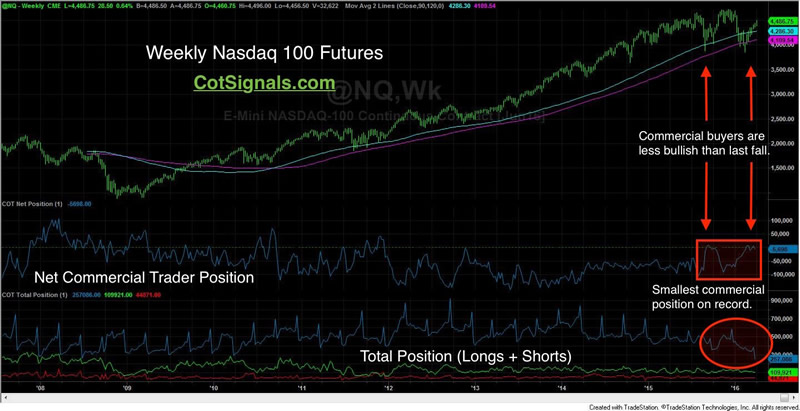
The Nasdaq 100 futures’ recent new high was not confirmed by the ‘commercial trader’. In fact, they are completely disinterested.
The Nasdaq 100 futures chart is beginning to display what a top may look like. ‘Commercial buyers’ of the September decline were rewarded with new highs, less than a month later. They were quick to rush into this years’ decline and their current ‘net position’ nearly matches the total from the last run-up.
However, note the large decline in the total commercial position since the October 2015 highs. Their participation rate is the lowest since 2008.
Hence, the ‘commercial participation rate’ has been trending lower since March of 2014, at which time the Nasdaq made its high around 3680. This is just below the August 2015 and February 2016 lows, in the Nasdaq. The Nasdaq appears to be the leader of the group and has begun most of the recent moves.
Therefore, my outlook is that the Nasdaq may not breach its’ recent high around of 4725. It will be very interesting to see if the ‘commercial traders’ will confirm this rally by returning to the market place. Until, and if they do, sentiment should remain ‘bearish’.
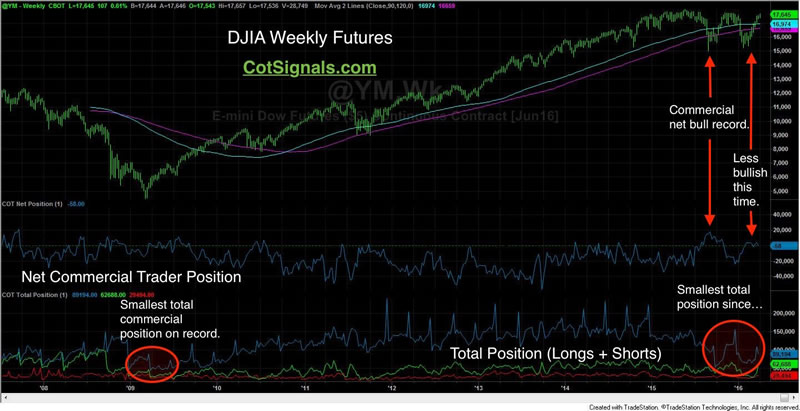
The Dow Jones futures recent rally is showing all the classic signals of a rally out of breath via divergences in price and momentum between price and commercial trader action, while guarded under the umbrella of declining volume and open interest.
I have illustrated a similar pattern to the Nasdaq on the Dow Jones’ futures chart. As you can see, ‘commercial traders’ set a ‘bullish net position’ record on the late summer decline of 2015. Much deeper analysis reveals that the new ‘net long record’ came on the heels of the smallest total commercial position in years. While it still created a fantastic trading opportunity, that I was able to capture on a short-term basis. I believe the broader pattern is ‘indicative’ of a ‘bearishly divergent’ top based on ‘commercial trader behavior’ patterns and activity.
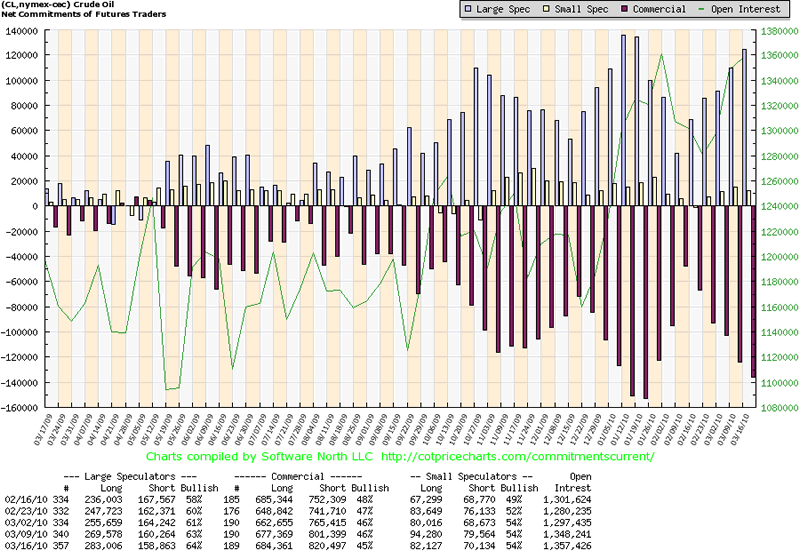
The table below should provide a perspective on the commercial traders ‘lack of interest’ during this economic and geopolitical climate.
‘Fear’ is the primary cause for the declining commercial participation rate. The ‘commercial traders’ are among the most well-informed group amongst market participants. Their unwillingness to participate, at these prices, reveals two main key factors;
- The current prices are distorted enough so as not to draw them into the market, on either side.
- The current banking and political environment is far too ambiguous for them to place any long-term bets before the U.S. Presidential elections take place.
CONCLUDING THOUGHTS:
There are many moving parts and influences that create major market trends and one of the most powerful forces is that of the Commercial Positions. When large financial institutions and funds are buying so should we.
The US stock market is at a critical juncture. Times like these are tough to gauge, time and trade but as long as we understand this we can tread lightly until we have confirmation of a new major trend.
The writing is on the wall and has been for over a year. Stock market tops are process and take a long time to mature before breaking down and starting a new bear market. I feel we are in the final days of the large cap topping stage and will see substantially lower prices this time next year.
Get My Simple ETF Swing Trades: www.TheGoldAndOilGuy.com
Join my pre-market video newsletter and start your day with a hot cup of coffee and my market forecast video: www.TheGoldAndOilGuy.com
Chris Vermeulen
Join my email list FREE and get my next article which I will show you about a major opportunity in bonds and a rate spike – www.GoldAndOilGuy.com
Chris Vermeulen is Founder of the popular trading site TheGoldAndOilGuy.com. There he shares his highly successful, low-risk trading method. For 7 years Chris has been a leader in teaching others to skillfully trade in gold, oil, and silver in both bull and bear markets. Subscribers to his service depend on Chris' uniquely consistent investment opportunities that carry exceptionally low risk and high return.
Disclaimer: Nothing in this report should be construed as a solicitation to buy or sell any securities mentioned. Technical Traders Ltd., its owners and the author of this report are not registered broker-dealers or financial advisors. Before investing in any securities, you should consult with your financial advisor and a registered broker-dealer. Never make an investment based solely on what you read in an online or printed report, including this report, especially if the investment involves a small, thinly-traded company that isn’t well known. Technical Traders Ltd. and the author of this report has been paid by Cardiff Energy Corp. In addition, the author owns shares of Cardiff Energy Corp. and would also benefit from volume and price appreciation of its stock. The information provided here within should not be construed as a financial analysis but rather as an advertisement. The author’s views and opinions regarding the companies featured in reports are his own views and are based on information that he has researched independently and has received, which the author assumes to be reliable. Technical Traders Ltd. and the author of this report do not guarantee the accuracy, completeness, or usefulness of any content of this report, nor its fitness for any particular purpose. Lastly, the author does not guarantee that any of the companies mentioned in the reports will perform as expected, and any comparisons made to other companies may not be valid or come into effect.
Chris Vermeulen Archive |
© 2005-2022 http://www.MarketOracle.co.uk - The Market Oracle is a FREE Daily Financial Markets Analysis & Forecasting online publication.