


Gold And Silver – At Significant Support. New “Story” Developing
Commodities / Gold and Silver 2016 May 28, 2016 - 12:42 PM GMTBy: Michael_Noonan

 With the holiday weekend, the focus will be on charts only for, ultimately, they reveal the truest story of what is developing in any market. There is one more trading day in May, next Tuesday, but we are using ending data from Friday, the 27th, for the monthly charts.
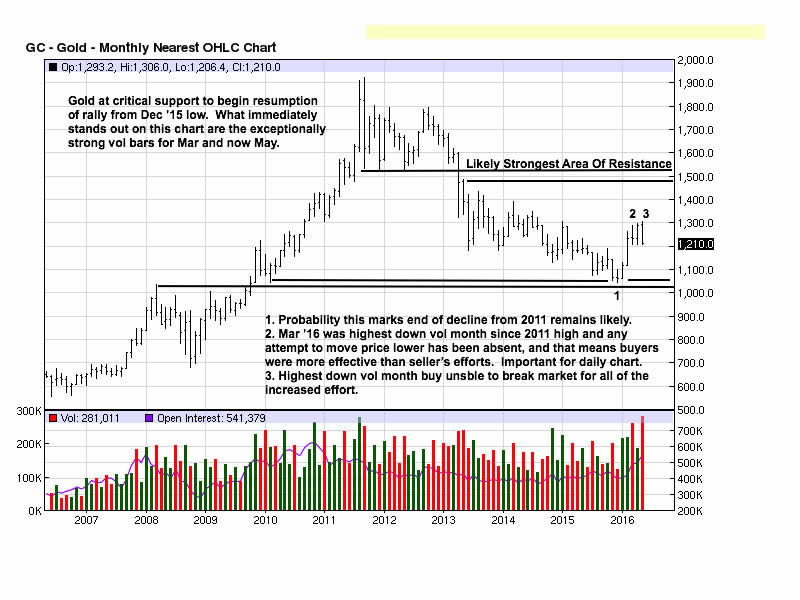
The rally in both gold and silver has been a significant change in market behavior, and these changes are telling the world that the decline from 2011 may have ended. We note the ending action at 1, on the monthly chart. Besides the obvious support and resistance areas, what stands out are the two high volume months when price closed lower each time, once in March, and now for May.
Volume is the energy behind every move. Without it, no trend can be sustained. Always remember, exceptionally large volume is when smart money movers are in action, either covering old or taking new positions, in the market. It is during these high volume events that one can see the “footprints” left behind by smart money movers. We define “smart money” as those who move and influence market direction, to keep it simple.
To put bars 2 and 3 into context, when bars overlap, especially moving sideways, it is the struggle/battle between buyers and sellers for control. The volume for bar 2 was the highest since the 2011 all time high for gold. It was interesting when there was no further downside movement in April. When price stops on a dime, as it were, under heavy selling pressure, it can only mean one thing. The apparent selling pressure was overwhelmed by opposing buyers in numbers great enough to halt any further decline. That means what looks like a selling month, for March, was actually net buying.
What is interesting about the lack of downside follow-through, after March, was that the low at the end of the month was where buyers took total control, and that specific low should now become important support on any subsequent retest because it was at the point where sellers could not move the market even a penny lower.
In the process of ending, May’s volume was even higher, so the battle between buyers and sellers was at an even greater pitch than in March. Yet, when one views that action, May was nothing more than another overlapping bar, and the exceptionally high selling effort did nothing to carry price lower, at least up to that point.
We all remember the surprise selling minutes when billions of dollars worth of gold were dumped on the market with impunity and no care for market impact, were the “seller” so concerned. There are fewer of those kinds of market dumping and their impact has lessened, considerably. When we talk about changes in market behavior, March and May exemplify the significance of that change. Gold is not selling off to lower swing lows, as occurred in the past. In the present rally/decline, the decline portion has not even approached the half-way retracement level, an indication of relative underlying market strength.
We see March and May as “messages from the market,” advertising its intent. Some little skirmishes designed to take one’s attention off that intent may yet follow, and that is when weak-handed players get lost in the shuffle.
This is the developing “story” as we see it, and it pays to lock onto further developments in order to take advantage of potential new upside trends that leads to greater probability for being profitable by harmonizing with the trend.
Because of the high volume that stopped at the March low, discussed above, that stopping area should now become support. Chart comments explain it further. We will instead add to the observation of volume increasing as price declined.
Smart money sells high and buys low. When smart money is active, volume increases. If smart money were selling gold, the highest volume would occur near the swing highs, and not after a $90 decline. The highest volume is at the low, [so far], so smart money is trying to hide its hand as it buys into the decline. Also, smart money has deep pockets, very deep, so they are not concerned with day-to-day price action even when price moves against them. They know price is going higher because they are the ones behind the move.
A $20, $30, $40 move, even more, against them is no big deal. Most often, it is smart money moving price against their position to shake out weak hands, and they keep buying whatever is sold from those who cannot afford such a move against them. Smart money does not like company. It is their purpose to create as many situations as possible to shake people out of the market. The current reaction is one such effort.
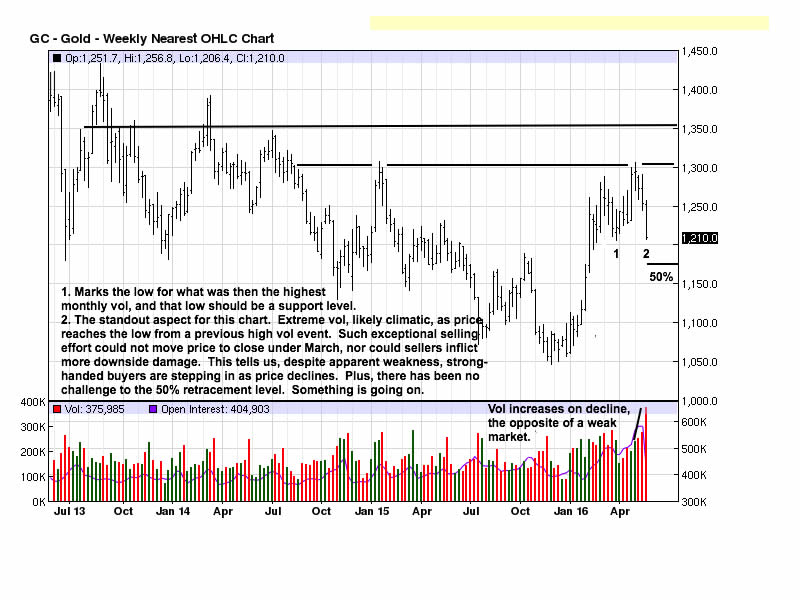
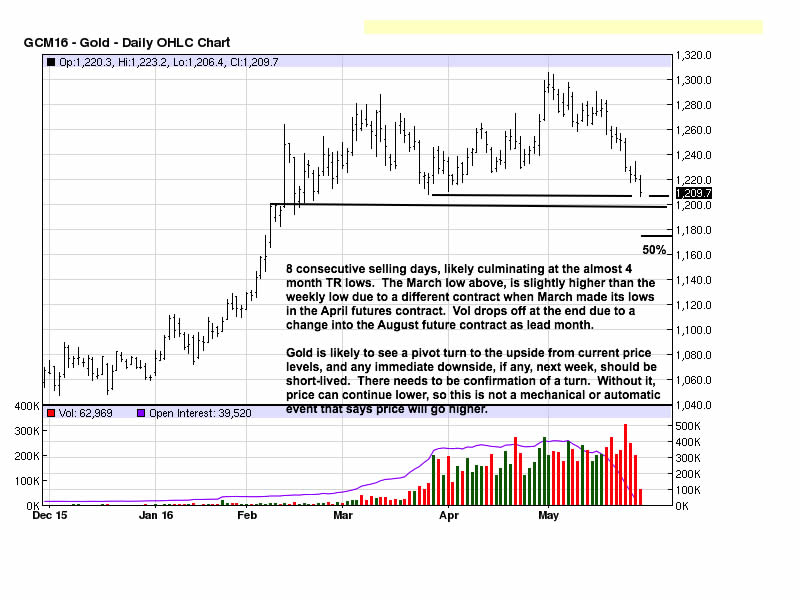
We often mention synergy between the various time frames. Right now, there is a consistent synergy from the monthly on down as price moves into a reaction area of support. As you look at the daily chart, what has been the net move from early February to the end of May? Zero, practically speaking, but look at all the “noise” the “distraction” in between. It appears that smart money is preparing for the advance almost everyone else has been waiting for.
If we are on target with this assessment, gold should start exhibiting stopping activity to end the current down trend from the May high, and price should start showing evidence that an uptrend continues to develop.
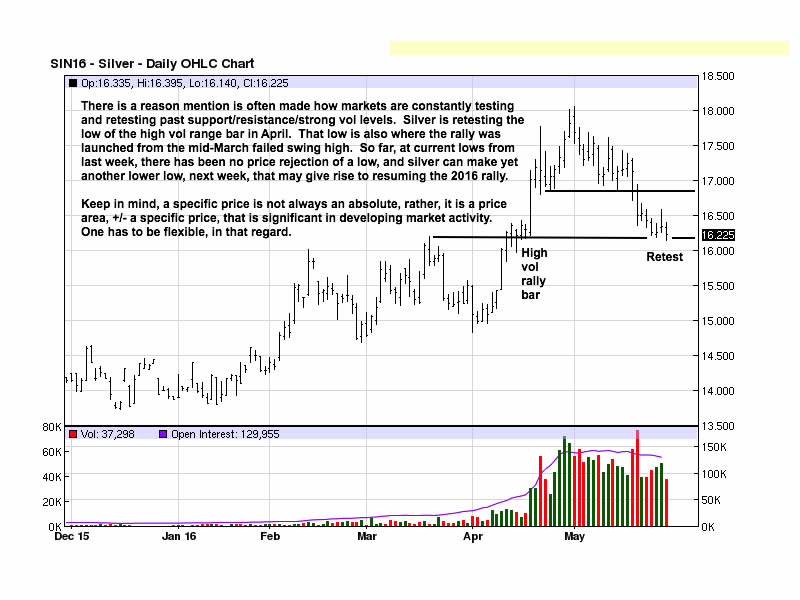
Silver. Second verse, nearly the same as the first. The details vary, but a developing “story” of support that keeps ostensible selling activity at bay is unfolding. It is a little bit like the United States supporting “fighting” ISIS. After 13 months of arming bombing ISIS, there has been no apparent effect, except that they are stronger. In comes “smart money” Russia, and using its incredibly effective aerial bombing, [new, increased and stronger “volume], there was a change in the developing “story.” ISIS was getting its ass kicked, and the “trend” has been turning.
This is the importance of observing new developments pertaining to volume, because it is a market changer and driver. April saw evidence of sharply increased volume in silver while price rallied. That is a market “message” of which to be aware.
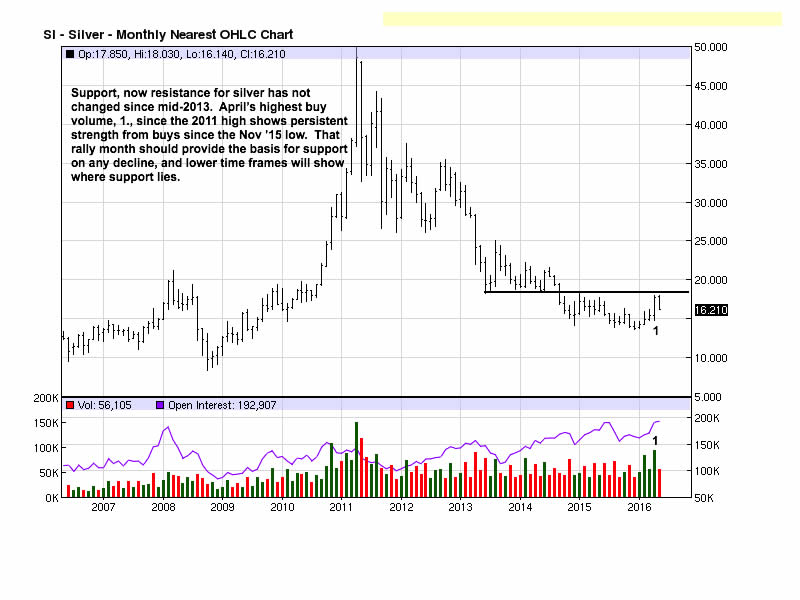
The “story” continues evidenced by the significantly smallest range bar at the end of the current decline from the May swing high. Why is the range so much smaller? Sellers are ineffectual, and buyers are stepping in to take control. If one does not pay attention to these “market messages,” it is easy to not maintain a focus on this larger picture, and instead, just look at the somewhat random day-to-day “noise” activity designed to keep people confused and bogged down in more meaningless details.
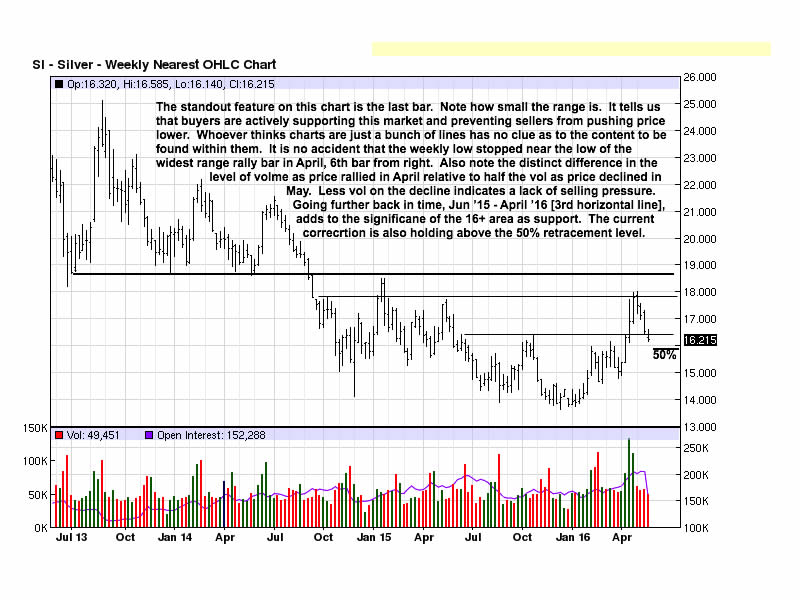
Silver has declined somewhat more grudgingly than has gold. It is more compact in the charts, which makes sense due to the considerably lower prices per ounce for silver as opposed to gold. The gold:silver ratio has been wavering in the 74.5 – 76+ to 1 area, recently, but that is still lower than the previous readings at 84:1, several weeks ago.
We see a new “story” developing [changes in developing market activity that create a change in direction]. There can be a little chaos during the transition, but a steady focus and careful price selection should begin to pay off.
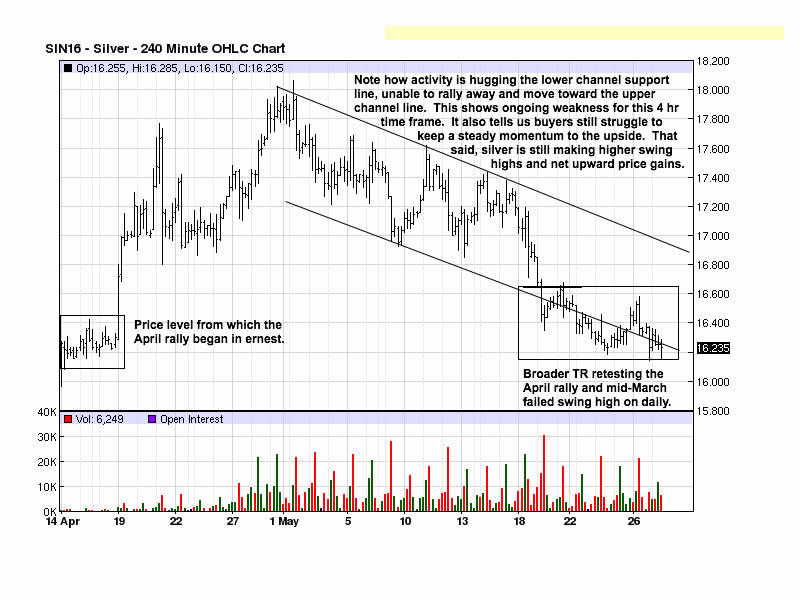
Here is a close-up picture of when price “took off to the upside” in April in this 4 hour chart, starting with the left-hand side activity. Now on the right side, price has returned to retest that April rally. During this correction, you can see how the level of price direction slowed considerably, starting on the 19th with its sharply higher volume.
The down-sloping channel defines the near-term trend, down, and price is struggling at the lower channel line. This tells us buyers have been unable to successfully counter the efforts of sellers, and until that changes, the shorter term trend will remain down. Should a change begin, at or near these levels, it will be a buying opportunity.
By Michael Noonan
Michael Noonan, mn@edgetraderplus.com, is a Chicago-based trader with over 30 years in the business. His sole approach to analysis is derived from developing market pattern behavior, found in the form of Price, Volume, and Time, and it is generated from the best source possible, the market itself.
© 2016 Copyright Michael Noonan - All Rights Reserved Disclaimer: The above is a matter of opinion provided for general information purposes only and is not intended as investment advice. Information and analysis above are derived from sources and utilising methods believed to be reliable, but we cannot accept responsibility for any losses you may incur as a result of this analysis. Individuals should consult with their personal financial advisors.
Michael Noonan Archive |
© 2005-2022 http://www.MarketOracle.co.uk - The Market Oracle is a FREE Daily Financial Markets Analysis & Forecasting online publication.