


Bifurcated Stock Market
Stock-Markets / Stock Markets 2016 Jun 05, 2016 - 08:04 AM GMTBy: Tony_Caldaro

 The market started the week at SPX 2099. After Monday’s holiday the market reached SPX 2103 on Tuesday. Wednesday the market declined to SPX 2085. Thursday the market rallied to SPX 2105, then returned to 2085 by Friday morning before ending the week back where it started at 2099. For the week the SPX/DOW were -0.2%, and the NDX/NAZ were mixed. Economic reports for the week were numerous and generally positive. On the downtick: the Chicago PMI, consumer confidence, construction spending, auto sales, monthly payrolls, ISM services and the Q2 GDP estimate. On the uptick: personal income/spending, the PCE, ISM manufacturing, the ADP, factory orders, plus, the unemployment rate, trade deficit and weekly jobless claims all improved.
LONG TERM: neutral
While OEW continues to quantify medium and long terms waves successfully, it still requires the observer of the wave patterns to interpret them properly. With 120 years of historical stock market data as reference, this is generally not that difficult. What we present here, in this blog, is an opinion of the current wave pattern that is unfolding in the market. It should not be taken as a recommendation, or investment advice. It is only an opinion that is subject to change, and sometimes wrong.
We are in an unprecedented era of Central Bank market intervention. It started off simply enough in late-2008, and then expanded dramatically in early-2009, when the FED started buying debt instruments from their primary dealers (QE 1) to increase liquidity in the US banking system. This was followed by QE 2, Operation Twist, and finally QE 3 which ended in late-2014. The goal has been to improve the economy by what is termed the Wealth Effect: higher asset prices, creating more consumer spending, that would eventually trickle down to the rest of the economy.
Europe’s ECB eventually entered this liquidity/wealth effect scheme in 2011 with their LTRO version, and subsequently a full scale QE of their own which is still ongoing. In fact they are currently buying corporate and government debt. In recent years China and Japan have not only bought debt to increase bank liquidity, but admittedly have been buying stocks in their own stock market to fuel the wealth effect. Historically this kind of Central Bank intervention is unprecedented. US banks, for example, are now sitting on $2.4T in excess reserves. While historically the most they have ever had in excess reserves was $19B in 2001. The build up in Central Bank balance sheets has created massive worldwide liquidity.
While the Central Banks have been building their balance sheets, they have been intervening in various assets classes. Government Bond and Mortgage Backed security purchases are the most obvious, as they have been the foundation of the FED’s QE programs. Currency market intervention occurs on a regular basis, and is eventually reported some months later. Stock market intervention is generally never reported, with the exception of China and Japan’s recent admissions of directly buying equities to prop up their stock market. The FED, however, never reports direct stock market intervention, even though most market pundits know they were given that authority in 1988: https://en.wikipedia.org/wiki/Working_Group_on_Financial_Markets. This is the fundamental opinion, the following is the technical opinion.
For the past 60 years the SPX, and past 50 years the NYSE index, (both from inception), have moved perfectly in sync with the DOW on a long term basis. Their bull markets have been synchronized and their bear markets as well. Even after stock index futures became popular in the 1980’s these three indices remained in sync. There had been no exceptions, until 2011. When we first observed this deviation, we thought it was not a problem and these indices would eventually re-synchronize again before the bull market ended. Then another deviation occurred in 2016. And, this is where we are today.
We are now observing a bifurcated market between the futures driven SPX/DOW and the cash driven NYSE. Our OEW model is projecting a bear market in the SPX/DOW, which we track closely, and an ongoing bull market in the NYSE, which has received a lot of attention lately due to the strength in market breadth (NYAD). The only thing that can account for these deviations is periodic central bank intervention in the futures market. The FED can easily prop up the futures driven indices with futures purchases. But can not prop up the $24T NYSE cash market without derivatives, as it is too large to manipulate.
As a result of this market manipulation we now have two quantified counts with opposing views. The futures driven SPX/DOW, (NDX/NAZ as well), in a bear market. And the cash NYSE still in a bull market. Impossible? Actually very possible according to the OEW model.
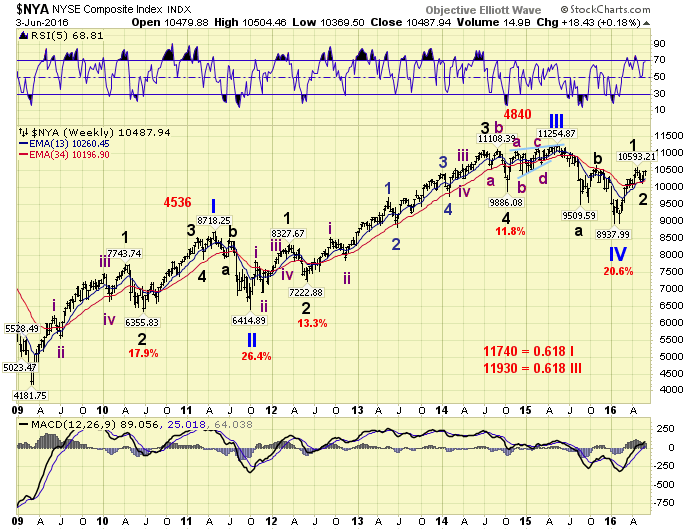
The NYSE quantitatively counts as four waves with a potential fifth wave underway. Five waves create a bull market. The SPX/DOW counts as a completed bull market in 2015, a large wave down into 2016, and a large wave up underway. These two large waves can be counted as waves A and B of an unorthodox bear market. Unorthodox in a sense, that the SPX/DOW can potentially make all time new highs while in an ongoing bear market. Historically, this has occurred before and in EW terms is considered an irregular B wave.
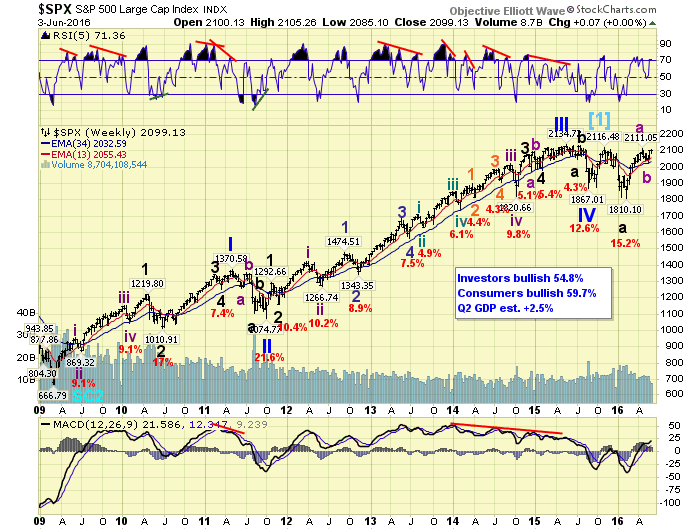
Irregular B waves can make marginal new highs, or even move much higher. Typically these B waves have a price relationship to wave A in multiples of 1.382, 1.50, 1.618, or even 2.0 times wave A. As a result of this observation we are forced to go to a long term neutral opinion. With a structural bear market in most of the indices, and a bull market in the cash index, there is no telling when, and from where, the bear market will impact all indices. Until then the futures indices and cash indices remain out of sync. Only when the bear market reasserts itself will all these indices realign again. The OEW model is still working, even though the Central Banks are manipulating the markets on an unprecedented scale.
MEDIUM TERM: uptrend
For the past couple of weeks we had been noting that the downtrend, SPX 2111 – 2026, had been weakening and a new uptrend may be underway. This new uptrend was confirmed this week. As a result of this uptrend we have updated the count to suggest Major wave B did not end in April at SPX 2111, but is still underway and subdividing. We now have Intermediate wave A at SPX 2111, Int. wave B at SPX 2026, and an Int. wave C uptrend underway.
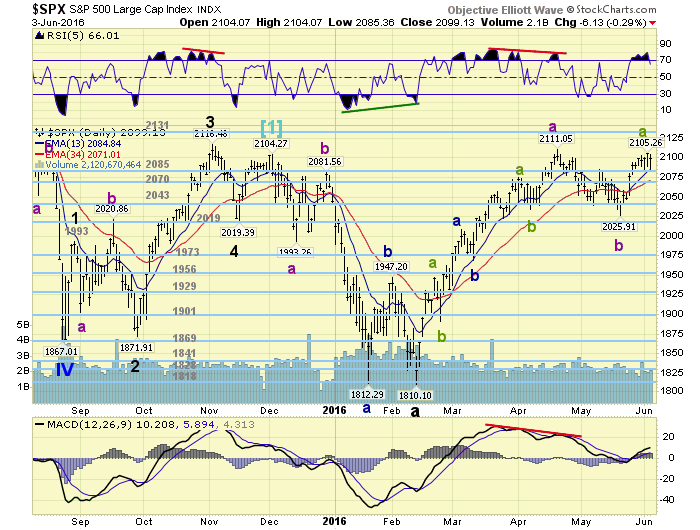
With Int. wave A just over 300 points, and Int. wave B only 85 points, Int. wave C can travel a long way before it concludes. This would suggest new all time highs in the SPX even though it would be within the context of a bear market pattern. For the NYSE, however, this type of advance should be enough to eventually end its bull market pattern. At that time, as noted previously, all the indices, cash/futures, would be in alignment for the bear market to get underway. In the meantime it appears we have a rising Major wave B in the SPX still underway, and a rising Primary V in the NYSE. Medium term support is at the 2085 and 2070 pivots, with resistance at the 2131 pivot.
SHORT TERM
With a simple and short double three concluding the downtrend at SPX 2026, the market reversed and turned higher. During the downtrend the 2043 and 2019 pivots supported the A and C waves, with B wave ending at the 2085 pivot. Quite an organized decline, despite the fact that it took a month to unfold.
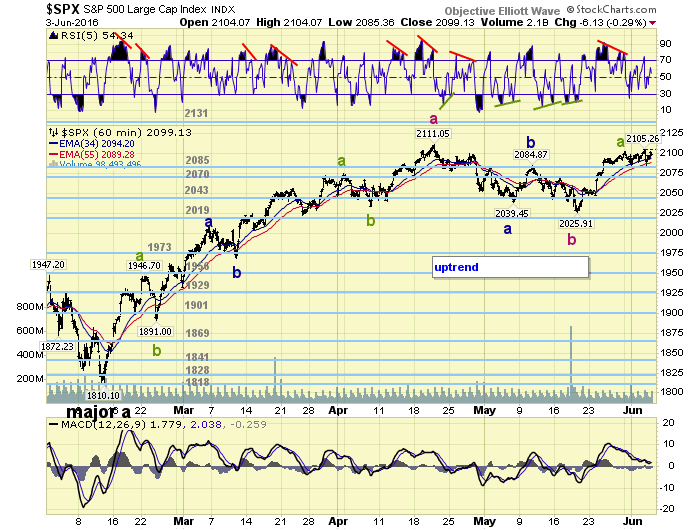
After that SPX 2026 low the market rallied essentially straight up, with small pullbacks, to SPX 2103 on Tuesday. After that, however, the market became quite choppy within a 20 point range: 2085-2101-2089-2105-2085. It currently looks like an irregular flat consolidation. Since Int. wave A looked like a quite extended double three: three Minor waves with three intervening Minute waves, we are going to label Int. wave C with the same pattern. Currently it looks like the SPX 2103/2105 area ended Minute wave a of Minor wave a. Short term support is at the 2085 and 2070 pivots, with resistance at SPX 2111 and the 2131 pivot. Short term momentum ended the week around neutral.
FOREIGN MARKETS
Asian markets were mostly higher on the week for a net gain of 0.7%.
European markets were nearly all lower for a net loss of 1.8%.
The Commodity equity group was mixed and lost 0.2%.
The DJ World index gained 0.6%.
COMMODITIES
Bonds rallied big on Friday, are uptrending, and gained 1.3% on the week.
Crude continues to uptrend but lost 1.9%.
Gold rallied Friday also, gained 2.3% on the week, uptrend may be underway.
The USD lost 1.6% on the week but is still in an uptrend.
NEXT WEEK
Monday: FED chair Yellen gives a speech at 12:30. Tuesday: consumer credit. Thursday: weekly jobless claims and wholesale inventories. Friday: consumer credit and the budget deficit.
CHARTS: http://stockcharts.com/public/1269446/tenpp
After about 40 years of investing in the markets one learns that the markets are constantly changing, not only in price, but in what drives the markets. In the 1960s, the Nifty Fifty were the leaders of the stock market. In the 1970s, stock selection using Technical Analysis was important, as the market stayed with a trading range for the entire decade. In the 1980s, the market finally broke out of it doldrums, as the DOW broke through 1100 in 1982, and launched the greatest bull market on record.
Sharing is an important aspect of a life. Over 100 people have joined our group, from all walks of life, covering twenty three countries across the globe. It's been the most fun I have ever had in the market. Sharing uncommon knowledge, with investors. In hope of aiding them in finding their financial independence.
Copyright © 2016 Tony Caldaro - All Rights Reserved Disclaimer: The above is a matter of opinion provided for general information purposes only and is not intended as investment advice. Information and analysis above are derived from sources and utilising methods believed to be reliable, but we cannot accept responsibility for any losses you may incur as a result of this analysis. Individuals should consult with their personal financial advisors.
Tony Caldaro Archive |
© 2005-2022 http://www.MarketOracle.co.uk - The Market Oracle is a FREE Daily Financial Markets Analysis & Forecasting online publication.