


Will the Stock Market Bubble Pop Regardless if the FED Never Raises Rates?
Stock-Markets / Stock Markets 2016 Aug 21, 2016 - 05:49 PM GMTBy: Chris_Vermeulen

 The current overall SPX pattern is a broadening top, which is usually a very reliable pattern. The market continues to look as though it wants to go even lower. The momentum shift, which I have been expecting, has been slow to start, however one should be prepared for this occurrence ahead of time.
Nevertheless, the large divergences which I have been viewing, in my proprietary oscillators, are most real, and, once the selling starts, the momentum should quickly move to the downside.
The current market is being supported by a lack of sellers more so than aggressive buying. With investors still thinking that there is no other place to store their money, they appear to be content with leaving their money with risk-on assets within a market that is pushing to all-time highs.
This type of mentality usually leads to large losses rather than big gains. There isn’t any real opportunity for growth in the SPX that I can see right now.
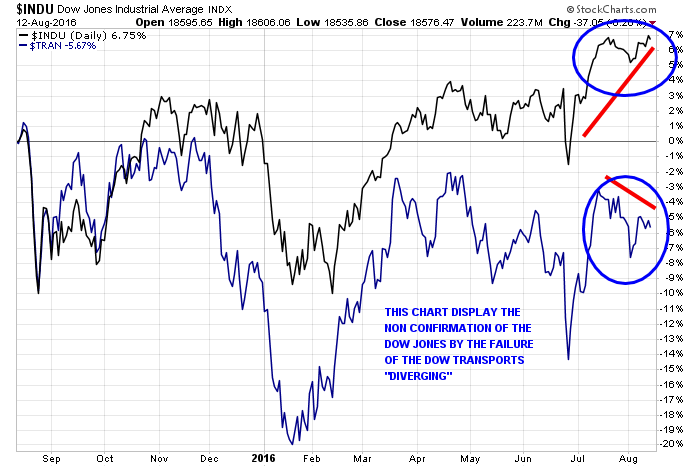
Dow Theory: Market Indexes Must Confirm Each Other
The Dow Theory was formulated from a series of Wall Street Journal editorials which were authored by Charles H. Dow from 1900 until the time of his death in 1902. These editorials reflected Dow’s beliefs regarding how the stock market behaved and how the market could be used to measure the health of the business environment.
Dow first used his theory to create the Dow Jones Industrial Index and the Dow Jones Rail Index (now Transportation Index), which were originally compiled by Dow for TheWall Street Journal. Dow created these indexes because he felt they were an accurate reflection of the business conditions within the economy, seeing as they covered two major economic segments: industrial and rail (transportation). While these indexes have changed, over the last 100 years, the theory still applies to current market indexes.
Market indexes must confirm one another. In other words, a major reversal from a bull or bear market cannot be signaled unless both indexes (generally the Dow Industrial and Transports Averages) are in agreement. Currently, THEY ARE DIVERGING,ISSUING A MAJOR NON-CONFIRMATION HIGH ON THE DOW JONES INDUSTRIAL AVERAGE. If one couples this with the volatility index (Fear Index), this is a warning sign and a recipe for disaster.
The FEDs’ monetary policy over the last eight years has led to unproductive and reckless corporate behavior. The chart below shows U.S. non-financials’ year-on-year change in net debt versus operating cash flow as measured by earnings before interest, tax, depreciation, and amortization (EBITA).
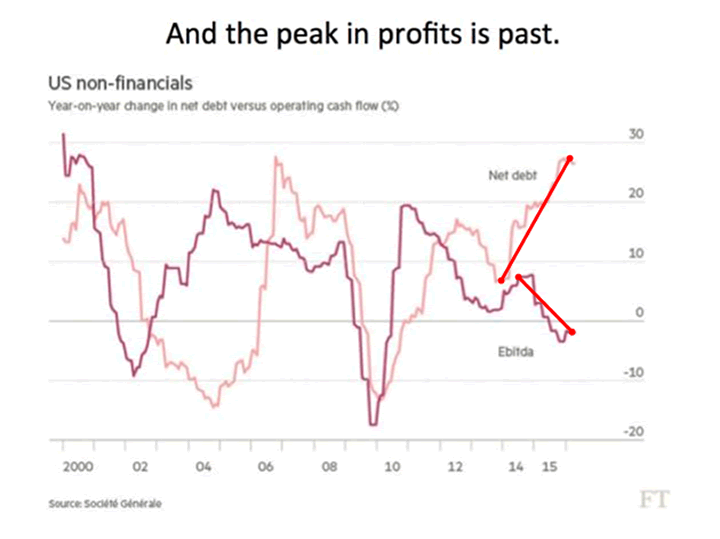
The growth in operating cash flow peaked five years ago and has turned negative year-over-year. Net debt has continued to rise, which is not good for companies.
This has never before occurred in the post-World War II period. In the cycle preceding the Great Recession, the peaks had been pretty much coincidental. Even during that cycle, they only diverged for two years, and by the time EBITA turned negative, year-over-year, as it has today, growth in net debt had been declining for over two years. Again, the current 5-year divergence is unprecedented in financial history!
Today, most of that debt is used for financial engineering, as opposed to productive investments. In 2012, buybacks and M&A were $1.25 trillion, while all R&D and office equipment spending were $1.55 trillion. As valuations rose, since that time, R&D and office equipment grew by only $250 billion, but financial engineering grew by $750 billion, or three times this!
You can only live on your seed corn for so long. Despite there being no increase in their interest costs while growing their net borrowing by $1.7 trillion, the profit shares of the corporate sector peaked in 2012. The corporate sector, today, is stuck in a vicious cycle of earnings manipulation management, questionable allocation of capital, low productivity, declining margins and growing debt levels.
Conclusion:
In short, I continue to pound on the table to help keep you and fellow investors aware that something bad, financially, is going to take place – huge events like the tech bubble, the housing collapse a few years back, and now national financial instability. Experts saw all these events coming months and, in some cases, years in advance.
Big things typically don’t happen fast, but once the momentum changes direction you better be ready for some life changing events and a change in the financial market place.
Follow my analysis in real-time, swing trades, and even my long-term investment positions so you can survive from the financial storm: www.TheGoldAndOilGuy.com
Chris Vermeulen is Founder of the popular trading site TheGoldAndOilGuy.com. There he shares his highly successful, low-risk trading method. For 7 years Chris has been a leader in teaching others to skillfully trade in gold, oil, and silver in both bull and bear markets. Subscribers to his service depend on Chris' uniquely consistent investment opportunities that carry exceptionally low risk and high return.
Disclaimer: Nothing in this report should be construed as a solicitation to buy or sell any securities mentioned. Technical Traders Ltd., its owners and the author of this report are not registered broker-dealers or financial advisors. Before investing in any securities, you should consult with your financial advisor and a registered broker-dealer. Never make an investment based solely on what you read in an online or printed report, including this report, especially if the investment involves a small, thinly-traded company that isn’t well known. Technical Traders Ltd. and the author of this report has been paid by Cardiff Energy Corp. In addition, the author owns shares of Cardiff Energy Corp. and would also benefit from volume and price appreciation of its stock. The information provided here within should not be construed as a financial analysis but rather as an advertisement. The author’s views and opinions regarding the companies featured in reports are his own views and are based on information that he has researched independently and has received, which the author assumes to be reliable. Technical Traders Ltd. and the author of this report do not guarantee the accuracy, completeness, or usefulness of any content of this report, nor its fitness for any particular purpose. Lastly, the author does not guarantee that any of the companies mentioned in the reports will perform as expected, and any comparisons made to other companies may not be valid or come into effect.
Chris Vermeulen Archive |
© 2005-2022 http://www.MarketOracle.co.uk - The Market Oracle is a FREE Daily Financial Markets Analysis & Forecasting online publication.