


Stocks Remain Close To Record Highs, Which Direction Is Next?
Stock-Markets / Stock Markets 2016 Sep 08, 2016 - 06:32 PM GMTBy: Paul_Rejczak

 Briefly: In our opinion, speculative short positions are favored (with stop-loss at 2,210, and profit target at 2,050, S&P 500 index).
Our intraday outlook is bearish, and our short-term outlook is bearish. Our medium-term outlook is now neutral, following S&P 500 index breakout above last year's all-time high:
Intraday outlook (next 24 hours): bearish
Short-term outlook (next 1-2 weeks): bearish
Medium-term outlook (next 1-3 months): neutral
Long-term outlook (next year): neutral
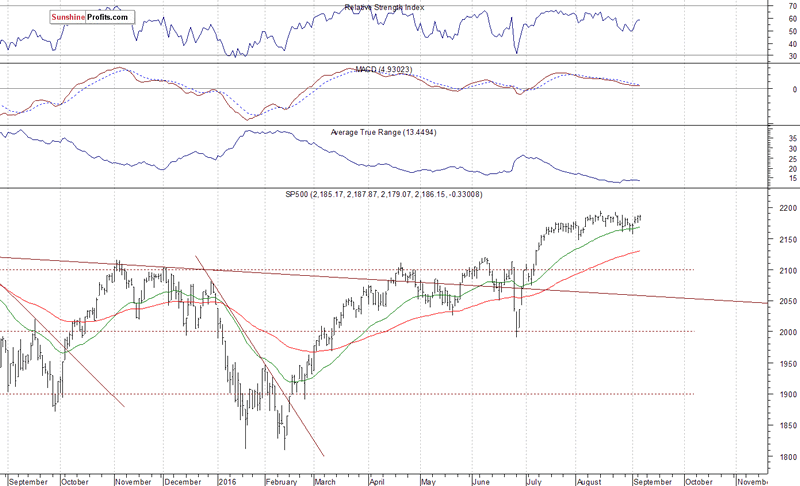
The U.S. stock market were virtually flat on Wednesday, as investors hesitated following recent move up. The S&P 500 index continues to trade close to its all-time high of 2,193.81. For now, it looks like a short-term consolidation following June - July rally. The nearest important level of resistance is at around 2,190-2,200. On the other hand, support level is at 2,160-2,170, marked by short-term local lows. The next support level remains at 2,150. Will the market continue higher? Or is this some kind of a topping pattern before downward reversal? There have been no confirmed negative signals so far:
S&P500 Futures Daily Chart
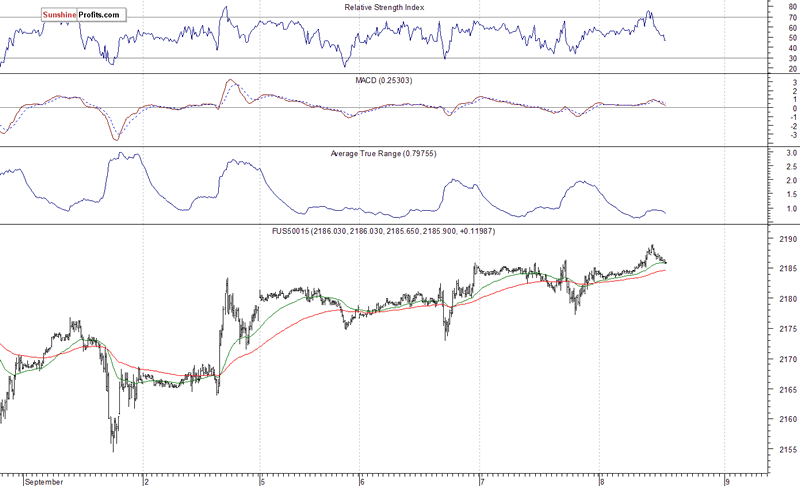
Expectations before the opening of today's trading session are virtually flat. The European stock market indexes have been mixed so far. Investors will now wait for the Initial Claims number release at 8:30 a.m. The S&P 500 futures contract trades within an intraday consolidation, as it remains close to all-time high. The nearest important level of resistance is at around 2,190-2,200. On the other hand, support level is at 2,175-2,180, among others, as we can see on the 15-minute chart:
S&P500 Futures 15-Minute Chart
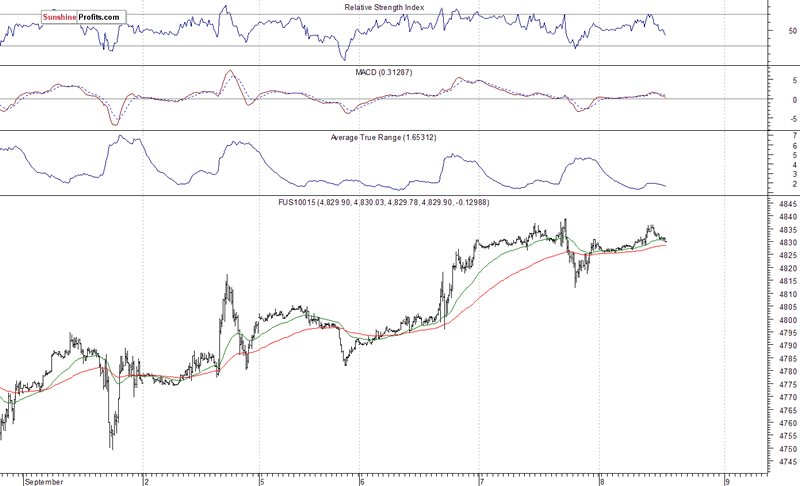
The technology Nasdaq 100 futures contract follows a similar path, as it currently trades close to all-time high. The nearest important level of resistance is at around 4,840-4,850. On the other hand, support level remains at 4,800-4,820, marked by previous level of resistance, as the 15-minute chart shows:
NASDAQ100 Futures 15-Minute Chart
Concluding, the broad stock market trades close to all-time high again, as the S&P 500 index retraces its late August move down. Will the S&P 500 index continue its long-term uptrend following over month-long fluctuations? Or is this a topping pattern? We still can see overbought conditions accompanied by negative technical divergences. Therefore, we continue to maintain our speculative short position (opened on July 18th at 2,162, S&P 500 index). Stop-loss level is at 2,210 and potential profit target is at 2,050 (S&P 500 index). You can trade S&P 500 index using futures contracts (S&P 500 futures contract - SP, E-mini S&P 500 futures contract - ES) or an ETF like the SPDR S&P 500 ETF - SPY. It is always important to set some exit price level in case some events cause the price to move in the unlikely direction. Having safety measures in place helps limit potential losses while letting the gains grow.
Thank you.
Paul Rejczak
Stock Trading Strategist
Stock Trading Alerts
SunshineProfits.com
Stock market strategist, who has been known for quality of his technical and fundamental analysis since the late nineties. He is interested in forecasting market behavior based on both traditional and innovative methods of technical analysis. Paul has made his name by developing mechanical trading systems. Paul is the author of Sunshine Profits’ premium service for stock traders: Stock Trading Alerts.
* * * * *
Disclaimer
All essays, research and information found above represent analyses and opinions of Paul Rejczak and Sunshine Profits' associates only. As such, it may prove wrong and be a subject to change without notice. Opinions and analyses were based on data available to authors of respective essays at the time of writing. Although the information provided above is based on careful research and sources that are believed to be accurate, Paul Rejczak and his associates do not guarantee the accuracy or thoroughness of the data or information reported. The opinions published above are neither an offer nor a recommendation to purchase or sell any securities. Mr. Rejczak is not a Registered Securities Advisor. By reading Paul Rejczak’s reports you fully agree that he will not be held responsible or liable for any decisions you make regarding any information provided in these reports. Investing, trading and speculation in any financial markets may involve high risk of loss. Paul Rejczak, Sunshine Profits' employees and affiliates as well as members of their families may have a short or long position in any securities, including those mentioned in any of the reports or essays, and may make additional purchases and/or sales of those securities without notice.
Paul Rejczak Archive |
© 2005-2022 http://www.MarketOracle.co.uk - The Market Oracle is a FREE Daily Financial Markets Analysis & Forecasting online publication.