


SPX Stock Market Downtrend Continues
Stock-Markets / Stock Markets 2016 Nov 06, 2016 - 06:31 PM GMTBy: Tony_Caldaro

 The week started at SPX 2126. After a bounce to SPX 2133 on Monday the market steadily declined to 2084 by Friday. There were three 10+ point rallies along the way, but they were all sold the same, or following, day. For the week the SPX/DOW lost 1.7%, and the NDX/NAZ lost 2.9%. On the economic front positive reports outpaced negative ones. On the downtick: Chicago PMI, auto sales, construction spending, the ADP, the WLEI and weekly jobless claims increased. On the uptick: personal income/spending, the PCE, ISM services, factory orders, monthly payrolls, the Q4 GDP estimate, plus the trade balance and unemployment rate improved. Next week will be highlighted by the Election.
LONG TERM: uptrend
This market has been quite a challenge since the beginning of 2016. A gap down opening on the first trading day of the year took the market from SPX 2044-1812 by mid-January. Then after a 135 point rally the market retested that low at SPX 1810 by mid-February. After that the market rallied to all time new highs by July, after pausing for a two day Br-exit drop in late-June. Now after making an all time high in August at SPX 2194, the market has been effectively declining for three months, hitting it lowest level on Friday at 2084. After all these gyrations the market is barely up 2% on the year.
The action over the past two years has been more like a demand/supply driven commodity than an equity market. A grind up to all time highs by May 2015. Then a quick nearly 300 point decline, followed by another 300 point decline, with a rally in between to within 1% of all time highs. Then just when it looked like a bear market was underway, the market stormed to all time highs. It has been quite a roller coaster ride for investors. And a dream come true for day traders, who thrive on volatility.
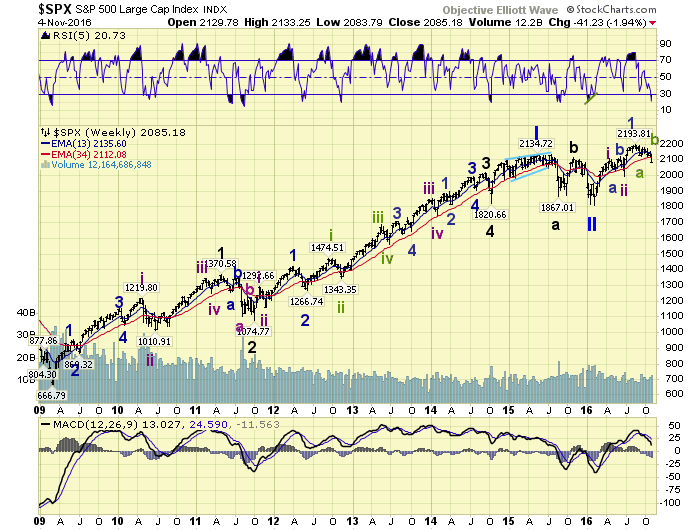
There are lots of opinions as to where this market is in it overall long term trend. Just ask any two people and you will likely get two different opinions. Our opinion, however, remains unchanged. We are counting the February low as the end of the May 2015 to February 2016 bear market. While the market only dropped 17%. We found five previous instances, out of the last twenty-five bear markets, ending with less than a 20% decline. Until SPX 1992 is broken to the downside we see no reason to change this opinion.
MEDIUM TERM: downtrend
From the February SPX 1810 low we now see quite an odd configuration of waves. Not seen since the early stages of the 1984-1987 bull market. We now have a five wave uptrend to SPX 2111, followed by a three trend decline to SPX 1992. Then we have another five wave uptrend to SPX 2194, and again followed by a three trend decline. With the last of these three trends still underway.
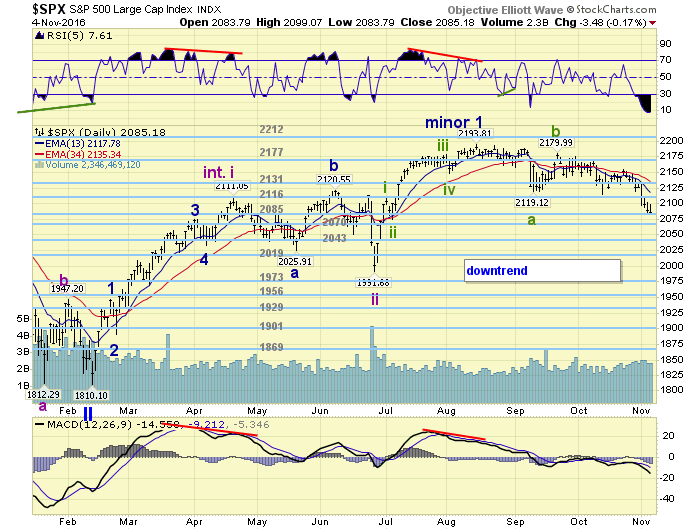
The labeling on the daily chart displays an Intermediate wave i, followed by three Minor waves for Intermediate wave ii. Then a Minor wave 1, followed by three Minute waves for Minor wave 2. Currently this entire Minor 2 correction has retraced a bit more than 50%, but less than 61.8%, of Minor wave 1. The 61.8% relationship is at the OEW 2070 pivot. At the close on Friday the daily/weekly RSI are now at oversold levels usually reached near, or at the end, of downtrends. Check out the weekly RSI in the weekly chart. The weekly MACD, while pointing down, is not a concern until it drops below zero. As you can observe, downtrends can become quite nasty when that occurs. Medium term support is at the 2085 and 2070 pivots, with resistance at the 2116 and 2131 pivots.
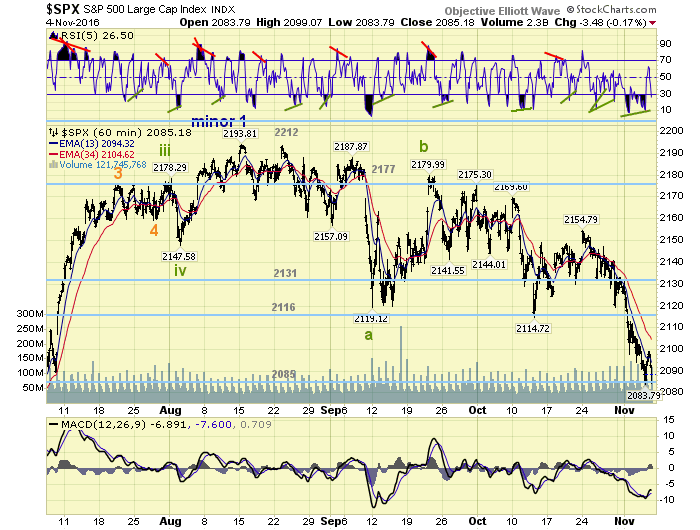
SHORT TERM
Since this three trend decline began in August at SPX 2194, it has been a series of small overlapping waves. Nothing that has looked impulsive at all, suggesting it is only a correction. During the three wave Intermediate ii correction, the first decline did a 23.6% retracement and then second completed a 38.2% retracement of Intermediate i. During this three wave Minor 2 correction, the first decline did a 38.2% retracement and the second decline is currently within the 50% to 61.8% retracement range of Minor 1.
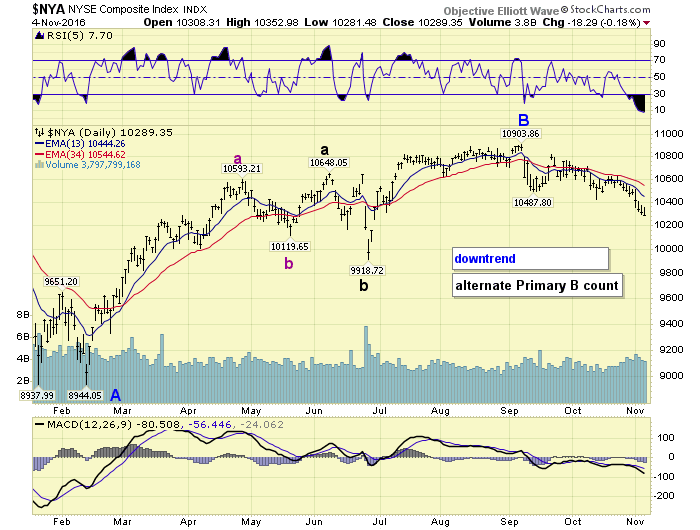
Should the OEW 2085 pivot range hold for a couple of days we could consider the downtrend over. If not, there are still two-three trading days to deal with the election, then the 2070 pivot is likely to hold. After those two pivots there is little support until the 2043 and 2019 pivots. Should those pivots get approached this alternate count may start coming back into play.
Short term support is at the 2085 and 2070 pivots, with resistance at SPX 2100 and the 2116 pivots. Short term momentum ended the week oversold. Trade what’s in front of you!
FOREIGN MARKETS
Asian market were mostly lower losing 1.6%.
European markets were all lower losing 4.1%.
The Commodity equity group were all lower losing 2.8%.
The DJ World index lost 2.0%.
COMMODITIES
Bonds continue to downtrend but gained 0.6%.
Crude remains in a downtrend and lost 9.5% on the week.
Gold is trying to uptrend and gained 2.2%.
The USD remains in an uptrend but lost 1.3% on the week.
NEXT WEEK
Monday: consumer credit at 3pm. Tuesday: the Election. Wednesday: wholesale inventories. Thursday: weekly jobless claims and the budget deficit. Friday: consumer sentiment.
CHARTS: http://stockcharts.com/public/1269446/tenpp
After about 40 years of investing in the markets one learns that the markets are constantly changing, not only in price, but in what drives the markets. In the 1960s, the Nifty Fifty were the leaders of the stock market. In the 1970s, stock selection using Technical Analysis was important, as the market stayed with a trading range for the entire decade. In the 1980s, the market finally broke out of it doldrums, as the DOW broke through 1100 in 1982, and launched the greatest bull market on record.
Sharing is an important aspect of a life. Over 100 people have joined our group, from all walks of life, covering twenty three countries across the globe. It's been the most fun I have ever had in the market. Sharing uncommon knowledge, with investors. In hope of aiding them in finding their financial independence.
Copyright © 2016 Tony Caldaro - All Rights Reserved Disclaimer: The above is a matter of opinion provided for general information purposes only and is not intended as investment advice. Information and analysis above are derived from sources and utilising methods believed to be reliable, but we cannot accept responsibility for any losses you may incur as a result of this analysis. Individuals should consult with their personal financial advisors.
Tony Caldaro Archive |
© 2005-2022 http://www.MarketOracle.co.uk - The Market Oracle is a FREE Daily Financial Markets Analysis & Forecasting online publication.